
fNIRS Analysis
NIRx was founded by fNIRS researchers and continues to publish articles in peer-reviewed journals alongside our customers.
Understanding proper analysis techniques is critical to ongoing success in your fNIRS research.
NIRx also regularly hosts in-person trainings, remote demonstrations and walk-throughs, and webinars to teach best practices related to NIRS analysis. Get in touch to learn about NIRS Analysis in Homer2, the MATLAB NIRS Toolbox, and more.
fNIRS Analysis
fNIRS has many advantages over other neuroimaging modalities. It allows to measure blood oxygenation level changes related to neural activation in a direct and non-invasive manner, with quick set-up times and high temporal resolution. However, fNIRS signals are susceptible to measurement noise and physiology-based systemic interference. Therefore, successfully extracting neuronal activity-related signals from your fNIRS data requires careful statistical analyses.
Here, we offer an overview of fNIRS Analysis topics, starting with fundamentals and study design, moving into analysis software options, and discussing fNIRS analysis in real-time or multi-modal environments.
Click on any of the links below to learn more.
Can't find what you're looking for? Get in touch with us to find out more!
Three aspects of the human body are fundamental to fNIRS neuroimaging. First, human tissue is relatively transparent to light in the near-infrared range, thus allowing photons to propagate. Second, hemoglobin has unique absorbing characteristics, allowing for oxygenation-dependent quantification of NIR light absorption. Finally, the brain’s demand for oxygen is altered by neuronal activation. NIRS allows to measure relative changes in cortical hemoglobin concentration, coupling this concentration to brain functioning is what designates fNIRS.

During a NIRx Workshop in Berlin in 2017, Dr. Jessica Gemignani extensively covered the fundamentals of fNIRS Analysis. In her lecture, Dr. Gemignani describes the process of turning raw physiological data into meaningful statistical results on the subject and group level, including many recommendations on the best methods for preprocessing your fNIRS data.
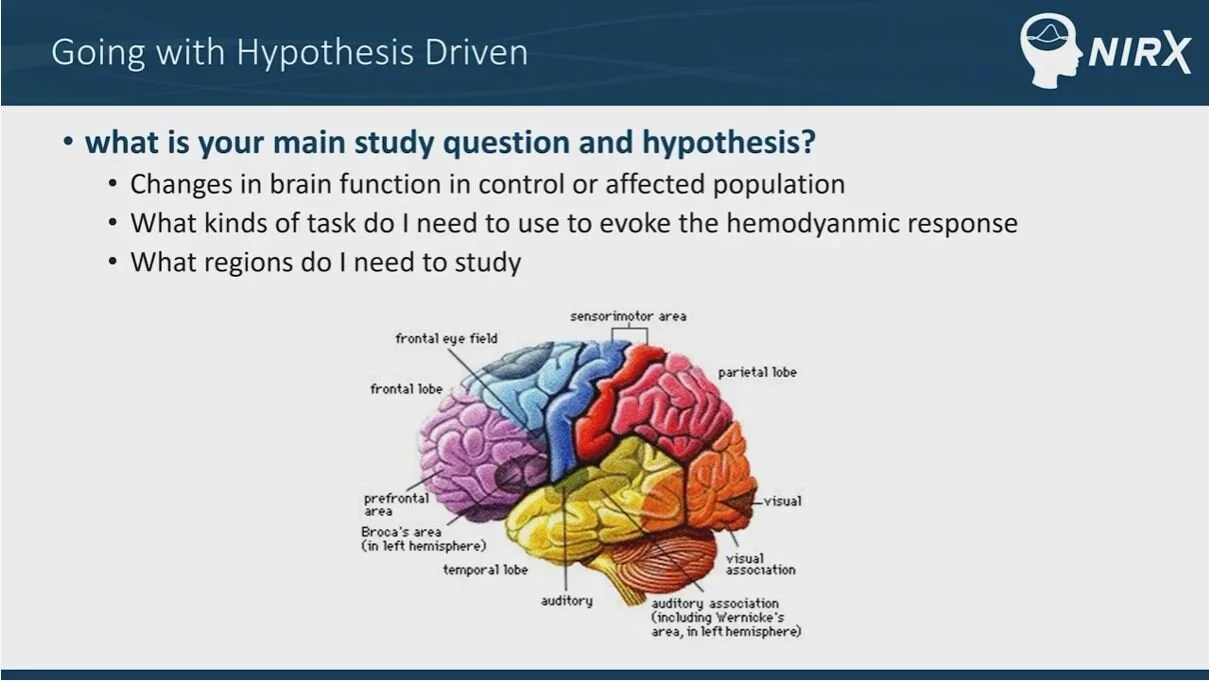
A successful fNIRS study starts with a well-designed experiment. Before collecting data, the researcher should ensure that they have a clearly defined hypothesis, need for the equipment being used, and an idea of what kinds of analysis methods they will apply to their data. In addition to reviewing the literature, we recommend that our customers review the many resources on the NIRx help center, such as lectures from various fNIRS experts on experimental design. Customers may also consult with the NIRx support team at support@nirx.net to construct a paradigm suitable for their application of interest.
Watch Dr. Afrouz Anderson discuss considerations and best practices for hypothesis selection and study design in fNIRS research during NIRx’s fNIRS workshop in Minneapolis in September, 2019.
The fNIRS community has rapidly grown over the past decades, resulting into sophisticated and user-friendly analysis tools, each offering unique qualities that may suit your research best. NIRx data can be loaded seamlessly into many of these tools with its custom file format or the more commonly used *.nirs file format.
Selected Analysis Software platforms are:
NIRS Toolbox is one of the newest and most sophisticated analysis software for fNIRS data. This toolbox consists of a set of MATLAB based tools, including functions for signal processing, visualization, and statistical analysis of fNIRS data. It allows for GLM, functional connectivity and multi-modal analysis, among many other features. The NIRS Toolbox was created an is maintained by Dr. Ted Huppert and his team at the University of Pittsburgh. While data from most any commercially available fNIRS system can be directly imported into the toolbox, NIRx data is the only kind that automatically imports 3-D probe and anatomical information. This functionality enables a greater range of analysis techniques within the toolbox.
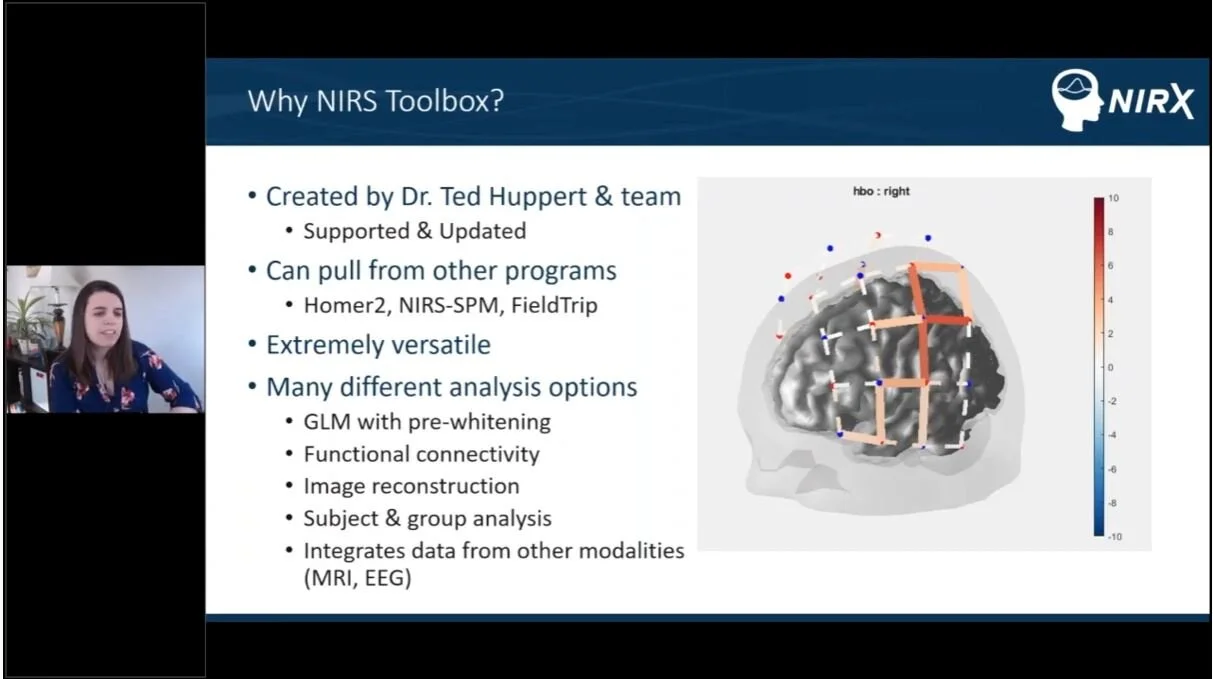
View this Introduction to NIRS Toolbox by the NIRx support team during a NIRx analysis webinar in April 2020.
Watch Dr. Ted Huppert walkthrough his NIRS Toolbox during a NIRx analysis webinar in April 2020.

Download NIRS Toolbox (requires MATLAB 2014a or later) from Github.
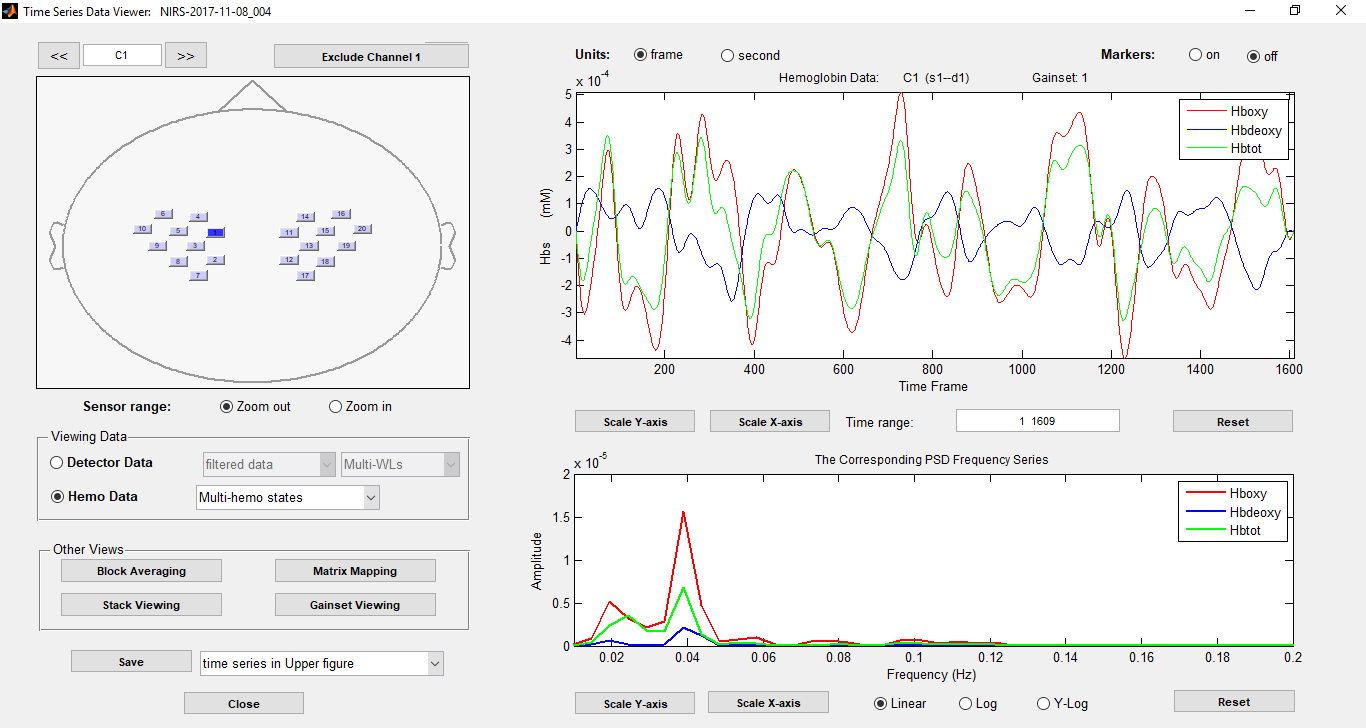
The Homer2 and Homer3 fNIRS analysis packages are some of the the most widely used for fNIRS analysis. Homer2 has evolved from the early 1990s, while Homer3 was just released in 2019. They both share a similar GUI, and support group analyses and re-configuration of the fNIRS analysis processing stream. Additionally, both software allows the user to integrate their own algorithms into the processing stream. All processing functions can also be accessed at the script level, for additional flexibility. All NIRx systems can save data in the *.nirs file format, which can be loaded seamlessly into both Homer2 and Homer3.

Image from the Homer3 GUI, illustrating the analyzed time course from certain channels on the left and an fNIRS probe on the right.
Download Homer2 from homer-fnirs.org | Download Homer3 from Github.
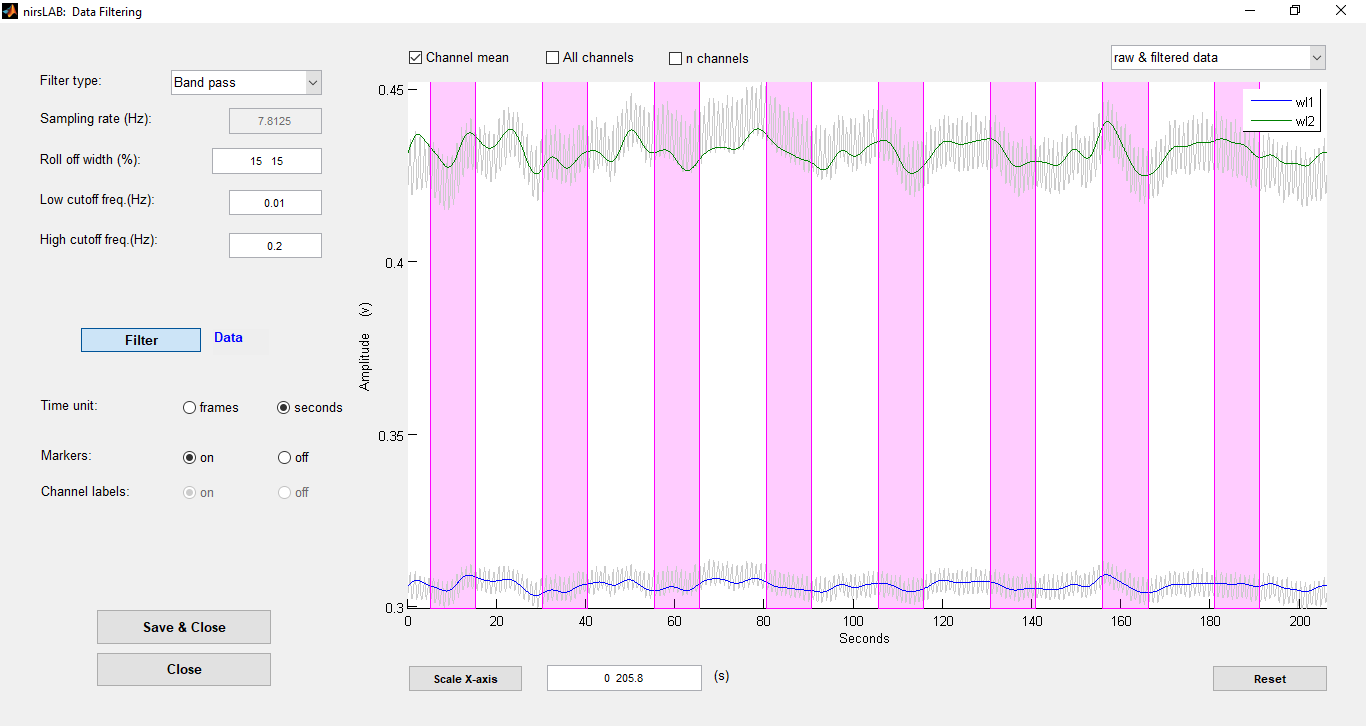
nirsLAB is an in-house creation of NIRx Medical technologies. nirsLAB is a versatile fNIRS data analysis environment, which aims to offer new users an introduction into studying time-varying near-infrared measurements of tissue.
nirsLAB offers several data inspection tools, as well as statistic parametric mapping (SPM) environment. The GUI-based tool box provide the resources to easily explore their data. Moreover, nirsLAB offers individual and group level analysis, meaning it allows users to quantitatively evaluate single and multi-subject findings in a variety of display formats.

Download nirsLAB from the NITRC Site
fNIRS is a promising candidate for Brain-Computer Interface investigations. Its great performance in acquiring cortical signals in the presence of muscle movements and the possibility of setting up measurements in realistic environments, make this neuroimaging technique ideal for many applications. It is often paired with EEG in real time investigations, to improve upon the classification accuracy of both modalities. Real-time fNIRS analysis requires sophisticated algorithms, that (for example) dynamically adjust predicted activation patterns.

Turbo Satori
Turbo-Satori is an advanced real-time analysis software for fNIRS data. It allows for fast, result-driven high-quality fNIRS research. Turbo-Satori is developed by Brain Innovation, exclusively for NIRx fNIRS instruments. Optimized for user-friendly real-time fNIRS brain computer interface (BCI) and neurofeedback research, Turbo-Satori integrates with NIRStar or Aurora fNIRS acquisition software seamlessly.
Real-Time fNIRS Analysis Webinar
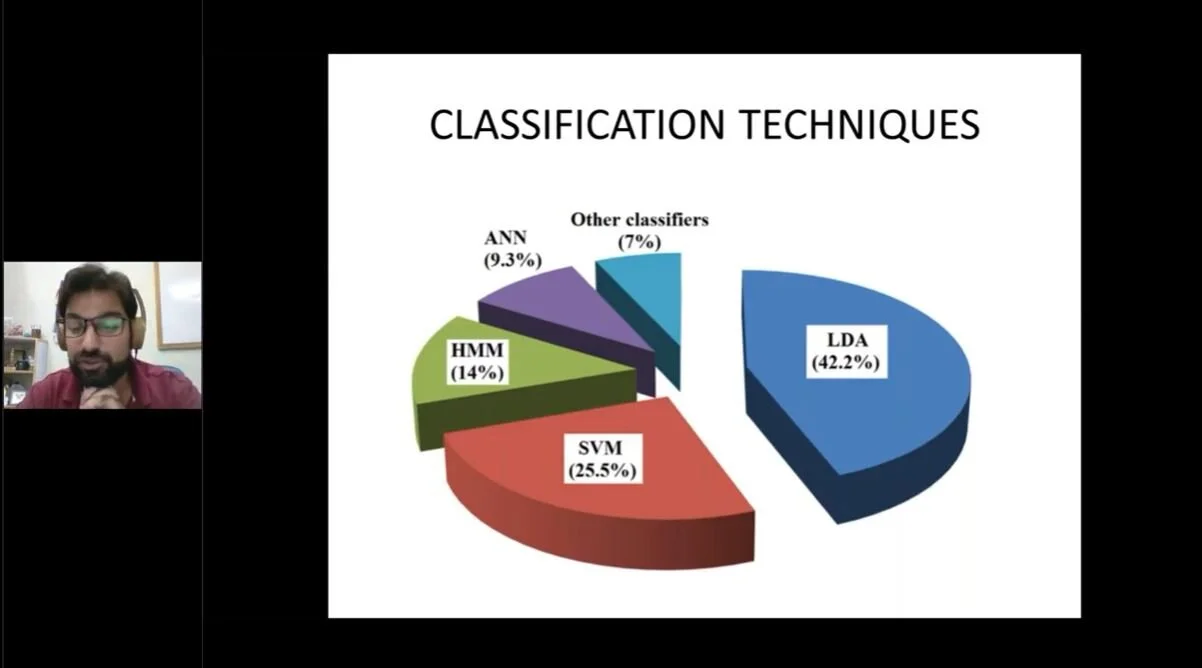
Dr. Noman Naseer has over 50 peer-reviewed publications in the field of fNIRS-based BCI. In this webinar, he shares his expertise on signal acquisition and processing for fNIRS-BCI. A practical demonstration of raw data analysis feature extraction and classification using MATLAB is also given.
Many research institutes appreciate multi-modal applications with fNIRS. By gathering information from several modalities, measurements can be rendered more robust, resulting into an advanced understanding of human brain functioning. Typical combinations are fNIRS and EEG, Eye-Tracking or fMRI, but tDCS and TMS have also been applied to concurrently modulate brain activity.
Dr. Ted Huppert from the University of Pittsburgh gives a talk on how measuring the brain concurrently with several modalities affects fNIRS Analysis, during the NIRx Medical Technologies UT Austin Workshop in October 2017.
Click below to learn more on NIRS
About NIRS and NIRx
- fNIRS and NIRx Overview
- NIRx NIRS Publication Sample
- NIRx Newsletters
- NIRx Webinars
- fNIRS Analysis
Applications
- fMRI-concurrent fNIRS
- EEG-concurrent fNIRS
- TMS-concurrent fNIRS
- Customized Real-time Analysis in NIRS: BCI / Neurofeedback
- Combining eye-tracking with fNIRS
- Using NIRS to conduct child and infant measurements
Products
- NIRScout NIRS Imaging System for Multi-Modal Integration
- NIRSport Portable NIRS Imaging System for Multi-Modal Integration
- NIRS Caps & NIRS Optodes (Probes)
- NIRS software