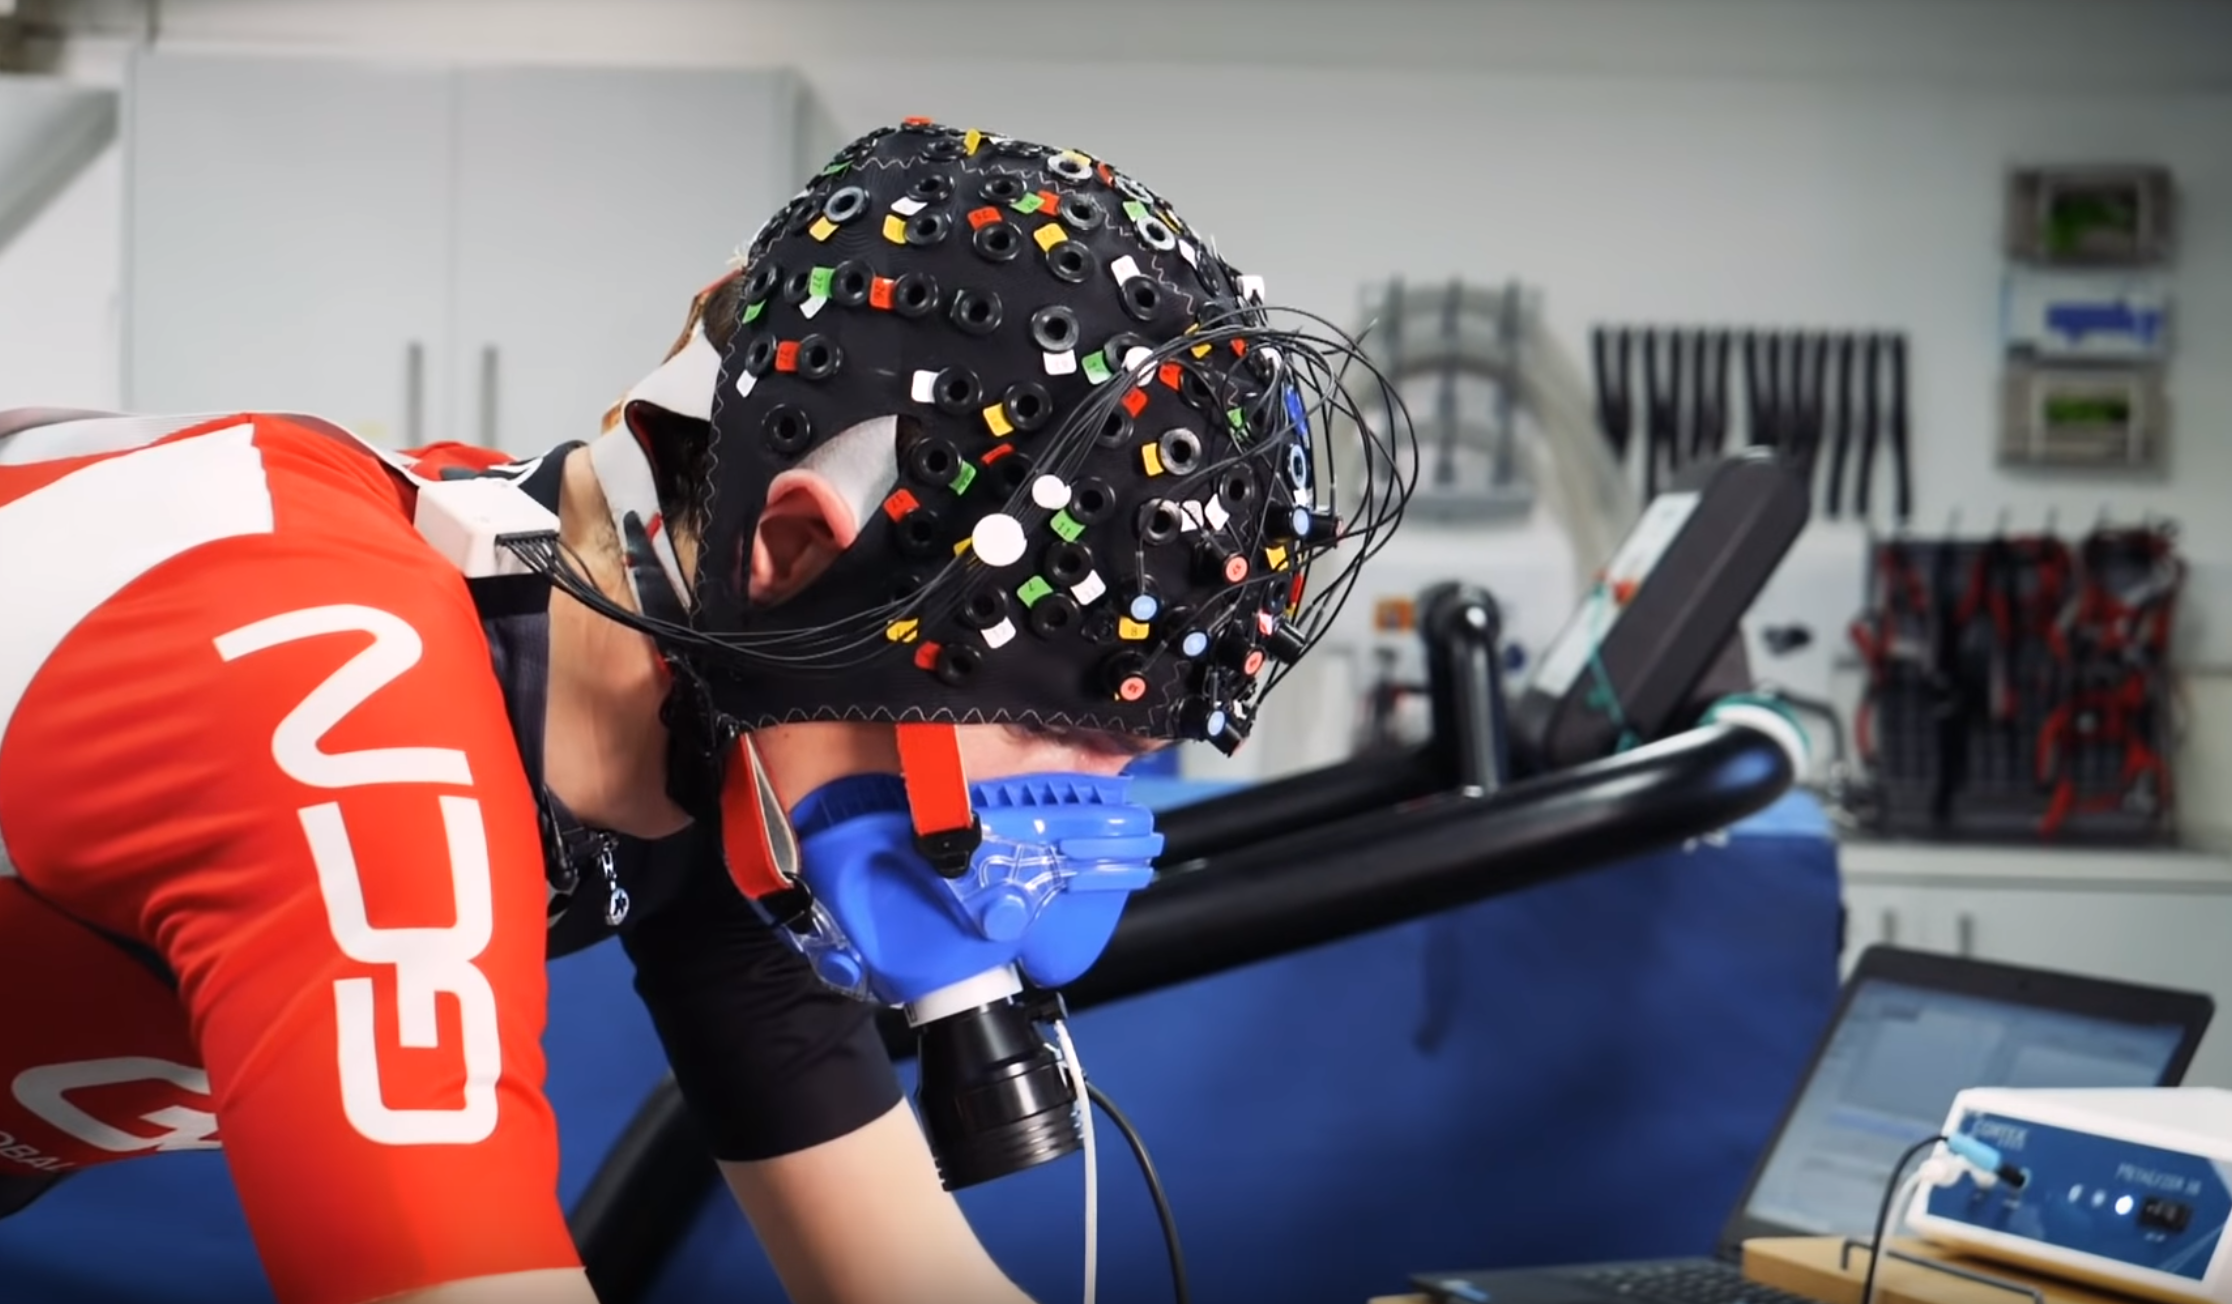
We are excited to announce the upcoming release of Satori 2.0 in mid-August!
Since the first launch of Satori in 2022, Brain Innovation and NIRx have been collecting feedback from fNIRS scientists about the most important features to include in the next version of the software. With Satori 2.0, we are thrilled to introduce these new and updated features that will enhance your data preprocessing and analysis capabilities. For summaries of the features already available in Satori, check out our tutorial series on YouTube.
In this blog post, we will delve into three key additions:
Python Based Solutions,
The data plotter,
Integrated user guides.
So let's dive in and explore the possibilities of Satori 2.0!
1. Python Integration
One of the most prominent additions are the Python functions executable within the Satori User Interface. Not only can you harness the power of existing Python algorithms and features, but you can also develop and include custom functionalities. This extensibility allows for the rapid expansion of fNIRS algorithms and the incorporation of novel features developed by the scientific community.
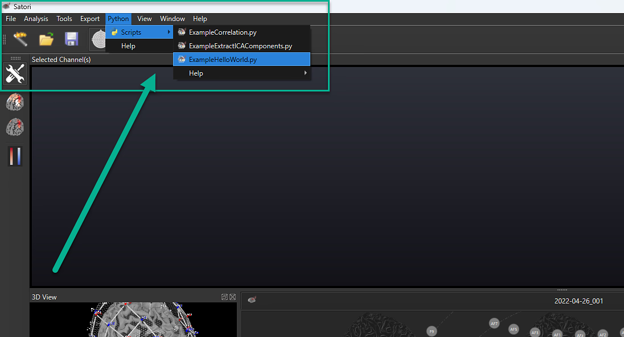
There are two ways Python is integrated into Satori. With the Python Scripts directly executable from the Satori header menu, you can take full control of your data processing pipelines.
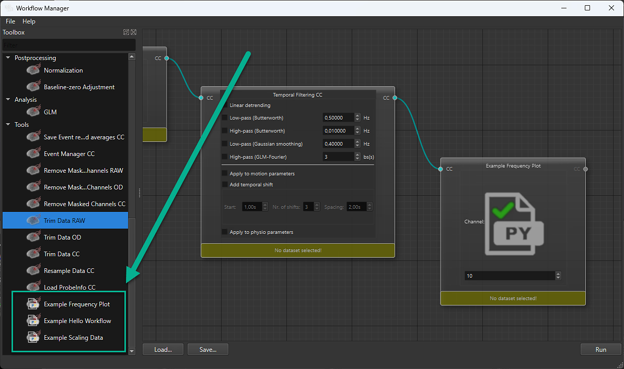
In the Workflow Manager, you can load data and seamlessly incorporate Python Based Workflow Modules which are pre-processing or post-processing the data. We have already included some example scripts which are supported by NIRx and Brain Innovation and documented in the integrated user guide.
2. Data Plotter
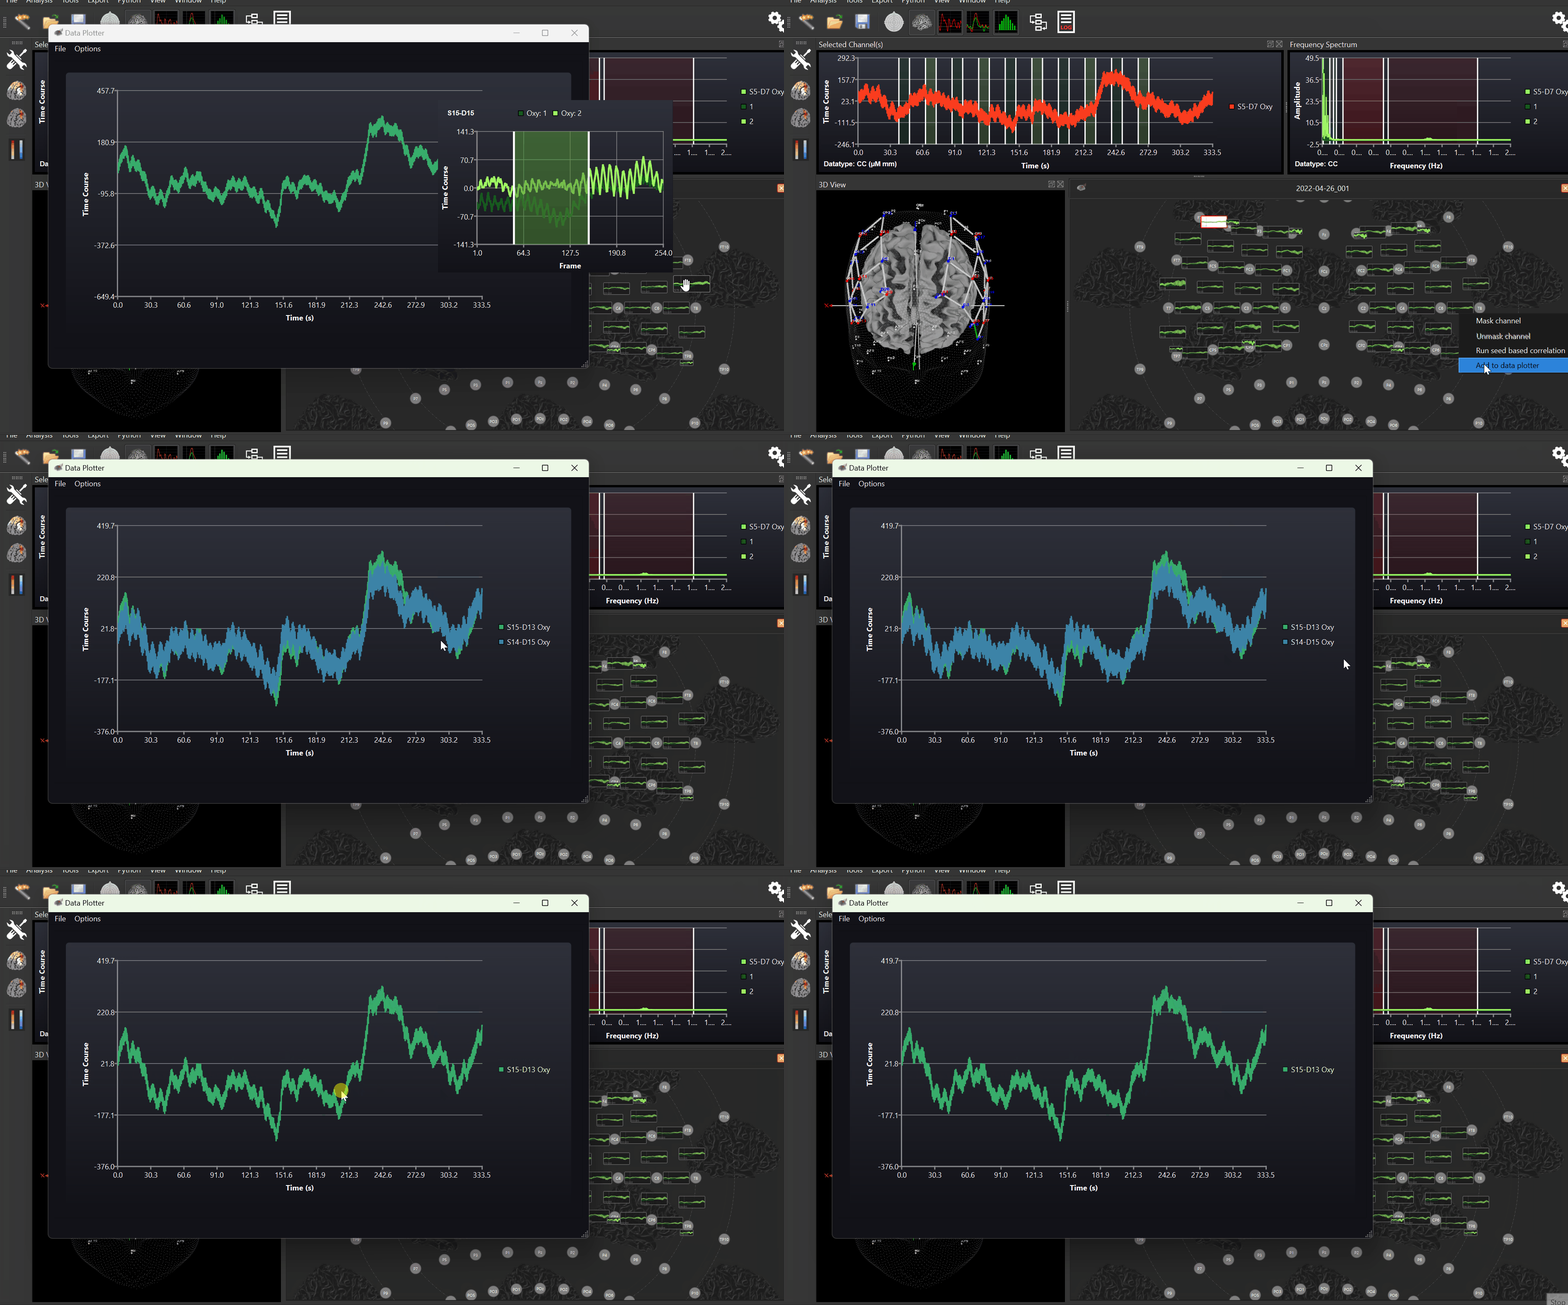
Satori 2.0 introduces an exciting new feature, the data plotter. In the data plotter, you can load datasets and view multiple channels simultaneously. While the Selected Channels view allowed for the viewing of multiple channels within a dataset, Satori 2.0 takes it a step further by enabling the visualization of channels from different datasets and the ability to include or exclude specific processing steps. By comparing different pre-processing steps, zooming in on time series data, and toggling the visibility of channels, you gain deeper insights into your data, quickly and easily. The data plotter also allows you to add peripheral physiology, such as data from NIRxWINGS, for a comprehensive analysis.
Of course, Satori 2.0 also brings enhancements to the user interface GUI, making your data analysis experience even more seamless. With improved window scaling, navigating through your data becomes more intuitive and efficient. Beyond the data plotter, additional data and analysis results viewing options are now available.
3. Integrated User Guide
We are excited to announce that improved documentation features accompany each processing step in the modules in the workflow manager and certified Python scripts. This is part of our commitment to equip users with the knowledge, instructions, and resources they need to effectively navigate the software and processing steps. To this end, we also have released a series of training videos available on our YouTube channel. With this comprehensive documentation, we hope users can quickly understand the functionalities of, and concepts behind Satori's data analysis tools.
Conclusion
With the introduction of the data plotter, Python integration, and in-built user guides, Satori 2.0 empowers users to clearly view time series data, customize their workflows, and enjoy an improved user experience. Satori 2.0 will be available in mid-August, contact us at consulting@nirx.net to see how this powerful software could impact your research. Happy data crunching!
Satori 2.0 Introductory Webinar
In August 2023, Dr. Jeremy Burnison from NIRx and Michael Lührs from Brain Innovation gave an overview of Satori and introduced the new Satori features provided with version 2.0.


