Tutorial Video Series: Take your Research to the Next Level with Satori!
As an fNIRS researcher, you understand the importance of staying at the forefront of knowledge and technology. To this end, NIRx Medical Technologies and Brain Innovation launched in 2022 an innovative software product called Satori. Satori is an easy-to-use and powerful fNIRS analysis software. It includes the current standard fNIRS processing methods and statistical tools. Check out a recent overview video here.
As part of a commitment to support our customers, we have created a comprehensive playlist of training videos for researchers starting out with this state-of-the-art software. From setting up preprocessing pipelines to accessing data analysis tools, this Tutorial Series provides a clear overview of the Satori interface, enabling researchers to maximize their efficiency. In this blog post, we will take a look at what you can expect from these videos. We hope they can help you get started with Satori and bring you closer to your next publication.
Mastering the Satori Interface
The Satori software tutorial series begins with an introduction to the user interface, ensuring that researchers become familiar with its features and functionalities. This helps users navigate through the software with ease, saving valuable time and streamlining their workflow. There is a clip describing the event manager where users can easily edit their experimental paradigm ready for preprocessing and analysis.
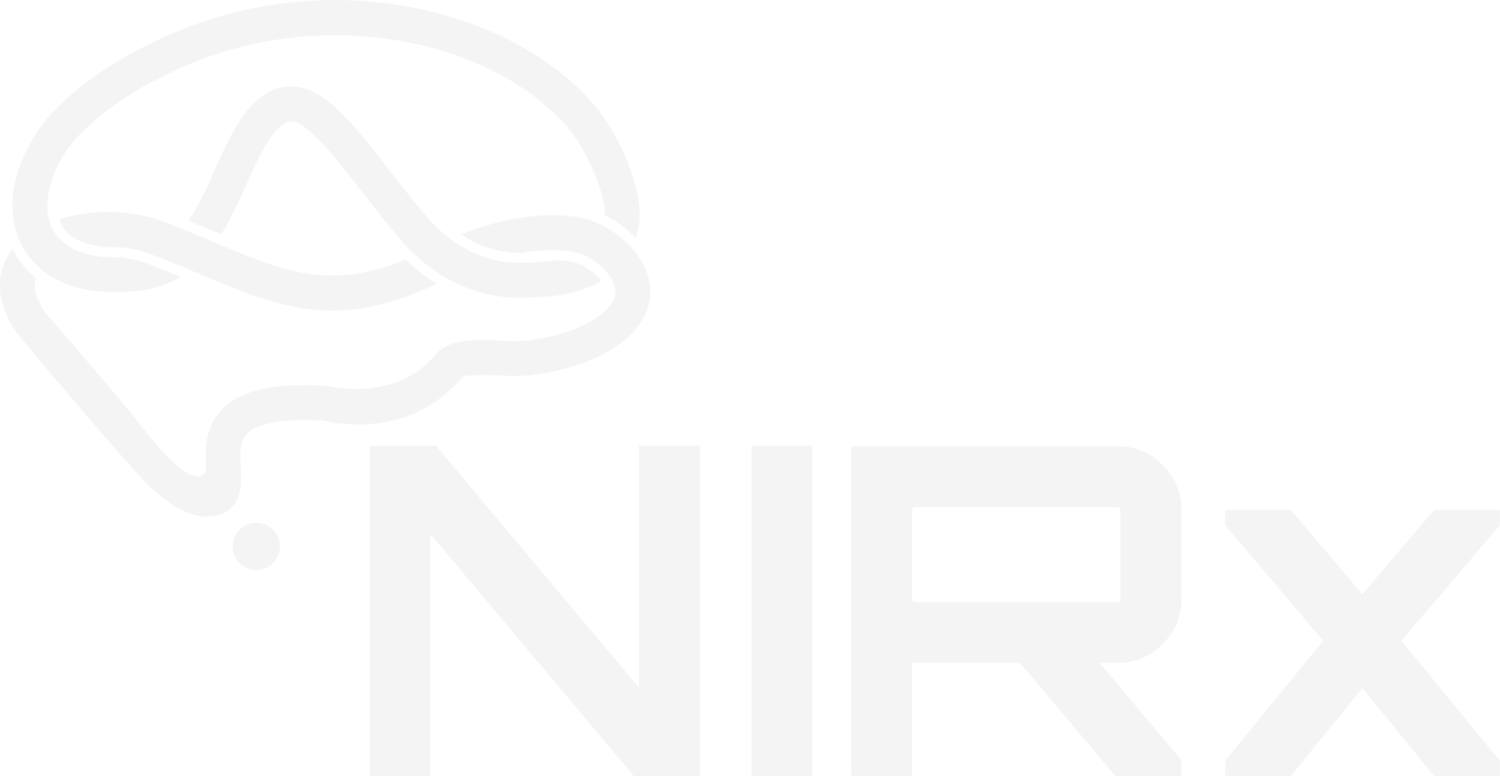
The videos also guide users through the workflow manager in which all Satori’s features such as transformations, preprocessing, post-processing, and analysis steps, can be dragged into a clear visualisation tool. This can be easily shared with your collaborators.

Data preprocessing and analysis
One of the most valuable aspects of Satori's software tutorial series is the focus on data preprocessing and analysis methods readily available within the software. These techniques are based on the most common and robust methods in the literature. The videos offer guidance on preprocessing options specific to your data. Researchers are shown the built-in methods like temporal filtering, short channel regression (in both preprocessing and analysis), normalization, channel rejection, and motion correction parameters such as TDDR (temporal derivative distribution repair), CBSI (correlation-based signal improvement), and spike correction. You can also learn how to configure each option in advanced settings.

These videos also provide information on how to analyse experiments within Satori. With the tutorial on running a single study GLM, users are shown how to set up the analysis, manage statistical parameters and thresholds, setting contrasts and including confound regressors. Satori is also able to run multi-study GLM analysis, SVM training, cross- and anti- correlation.
Advanced Data Visualization and Interpretation
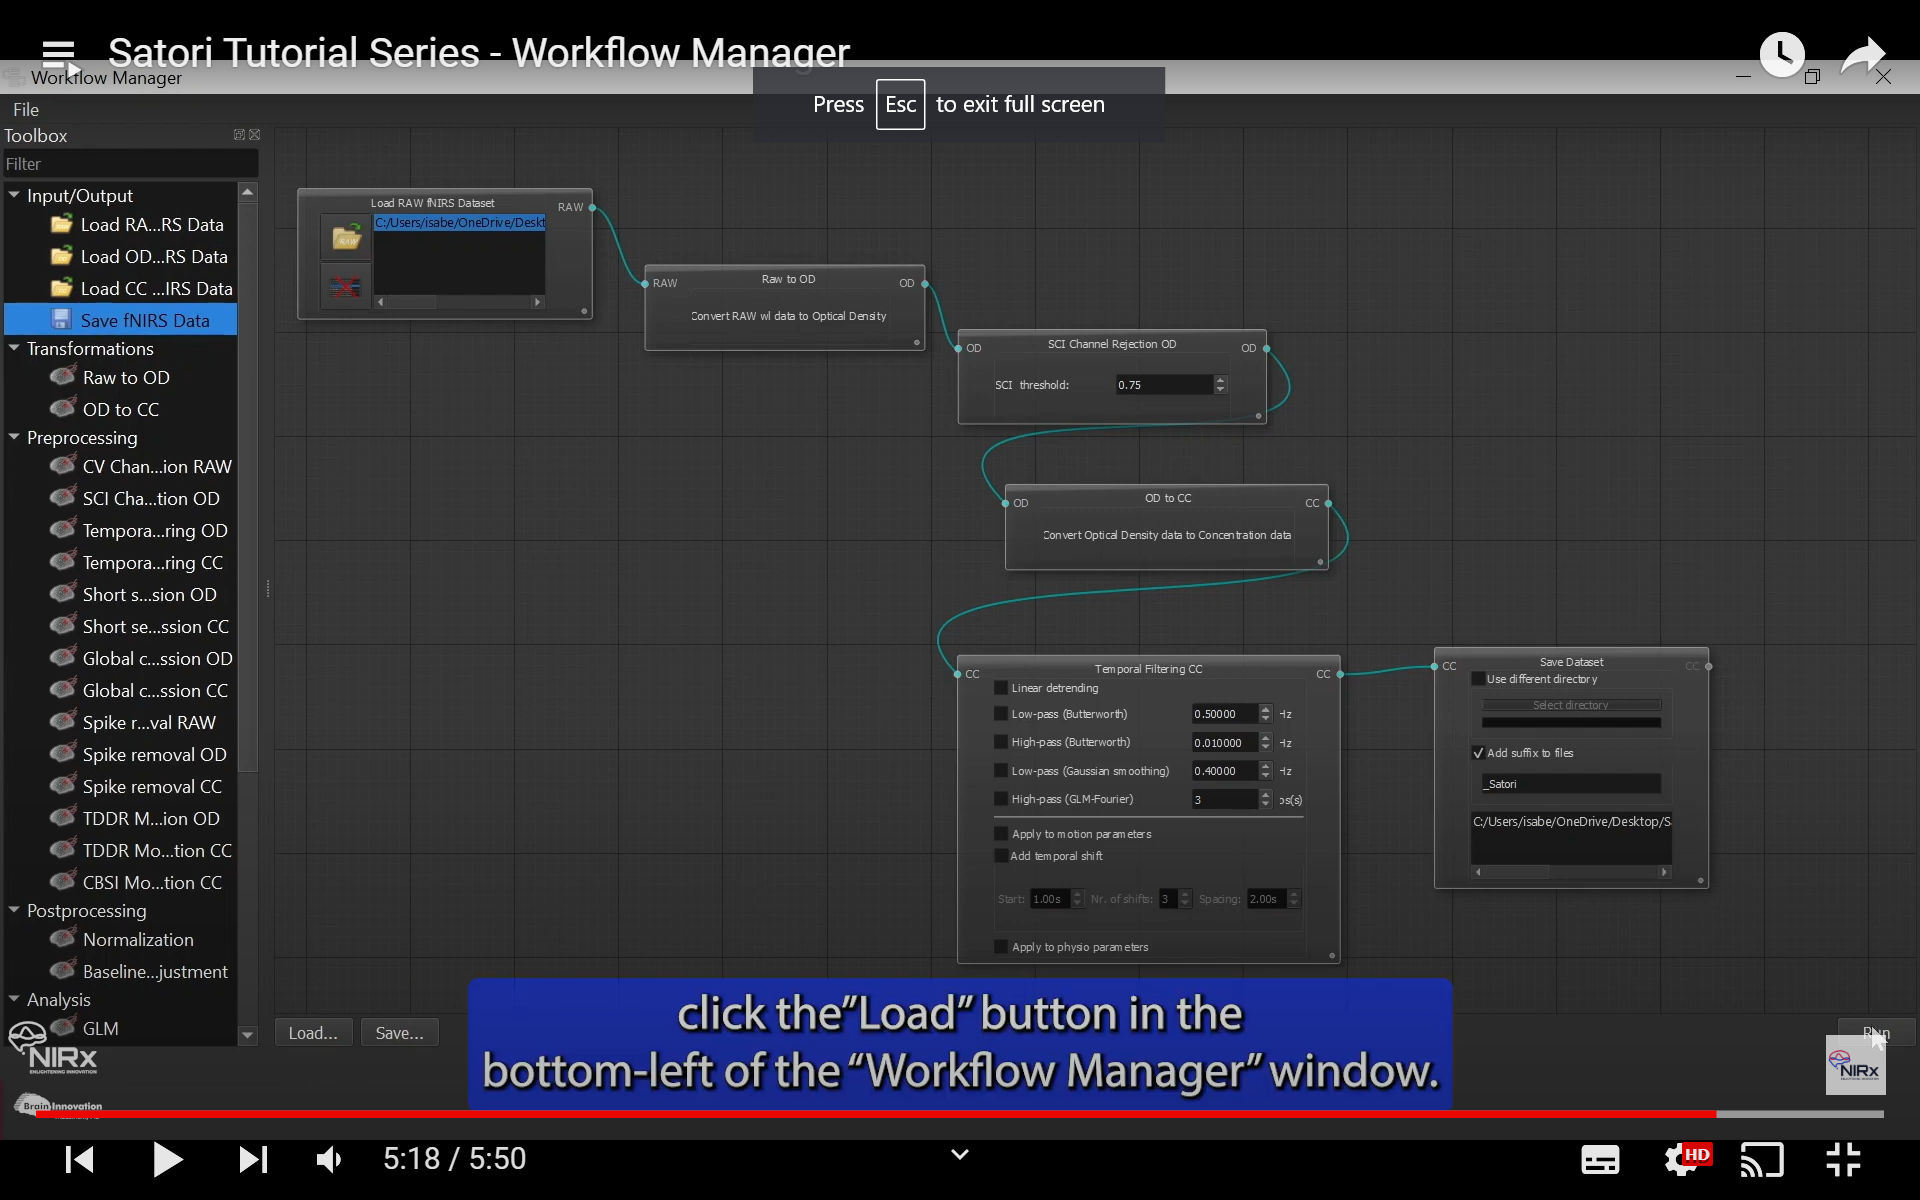
Data visualization is key to effectively communicating research findings. With Satori, this is accessible in just a few clicks. Satori's software training videos provide researchers with a quick overview of the data visualization techniques included. Part 2 of the single study GLM tutorial gives an example of how these visualization tools can be leveraged to transform complex data sets into clear, insightful visual representations with simple customization options for thresholds. These channel maps, graphs, and images can then be easily exported. These videos teach scientists how to display their data in a visually appealing manner within Satori, enhancing the dissemination and understanding of their research.
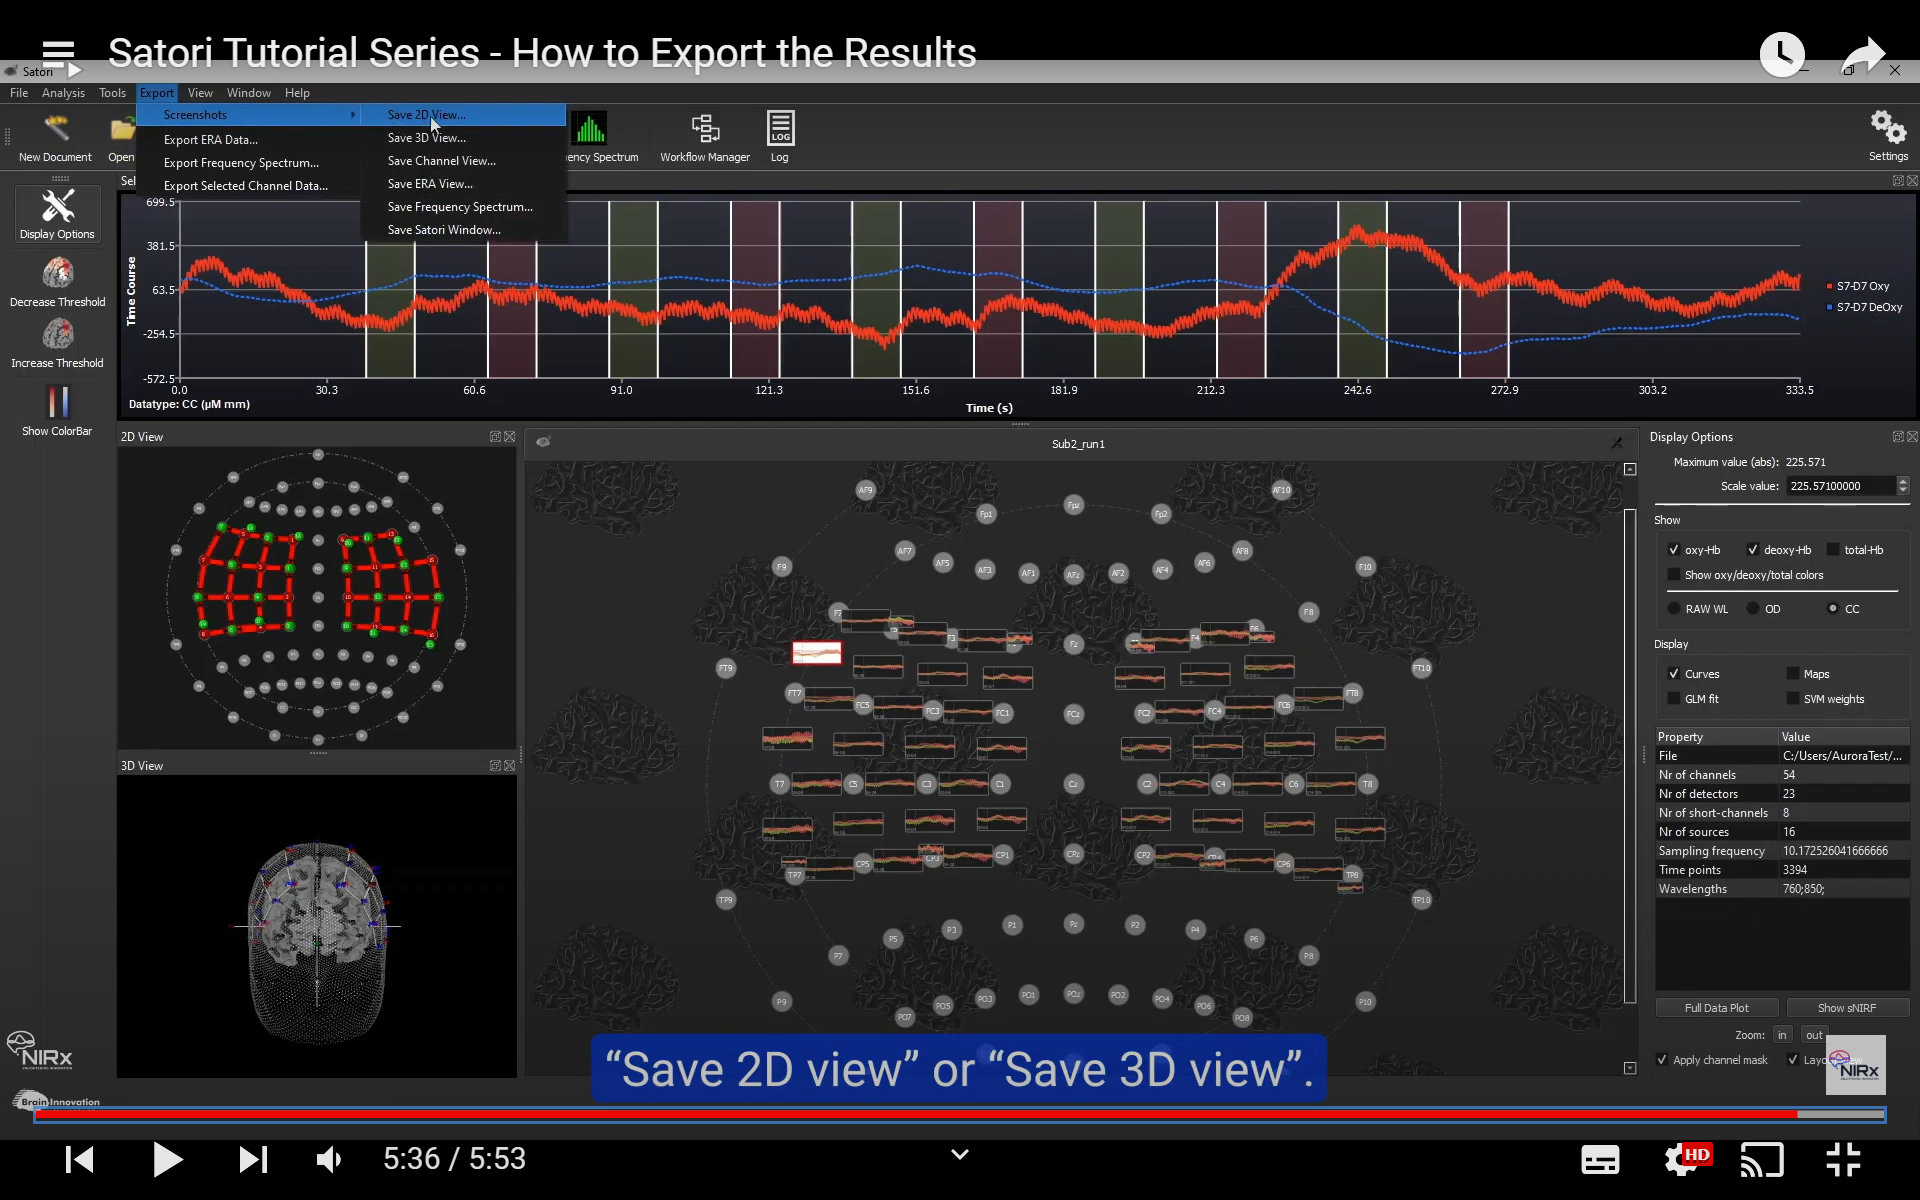
Extend Satori 2.0 with Python
We are excited to announce that the latest release, Satori 2.0 has inbuilt integration with Python. You can expand the capabilities of the software with your own scripts! We hope this interoperability empowers researchers to combine the strengths of Satori with other tools you may already be using, fostering a flexible and tailored approach to your research projects. Check out our recent webinar on these new features of Satori.
Conclusion
Scientific research is a dynamic and ever-evolving field, and staying ahead requires continuous learning and the adoption of cutting-edge technologies. Satori empowers researchers to get to the heart of their data with ease, without having to code a single line.
From mastering the software interface to preprocessing, analysis, advanced visualization, and integration with third-party tools, Satori's tutorial videos offer a helpful resource for researchers, equipping them with the skills and knowledge necessary to unlock their full potential with this fNIRS software.
Take your research to the next level with Satori! Subscribe to our Youtube Channel for more videos to come as features are added to Satori or contact us at consulting@nirx.net to find out more.

New Aurora with advanced multiplexing for high-density fNIRS
by Dr. Alexander von Lühmann
What is High-Density fNIRS and Diffuse-Optical Tomography, and why should we care?
In recent years, we have witnessed a comeback of High-density fNIRS studies. Dr. David Boas discusses the recent advances and perspectives in this 2 part-webinar.
HD-fNIRS can improve spatial resolution, depth, and lateral specificity, and can enable image reconstruction of cerebral activation (Diffuse Optical Tomography, DOT).
DOT fNIRS research was initially only done by a small number of experts in the field because it requires special infrastructure, such as many channels, high dynamic range instrumentation, and photon migration simulation algorithms.
DOT fNIRS systems have become more accessible and open toolboxes make it much easier to perform image reconstruction of the data. Here’s a walkthrough of the NIRStoolbox by Dr. Theodore Huppert.
"What are the trade-offs to achieve high-density measurements?"
Excellent signal quality and a good sampling rate are basic requirements for fNIRS research, regardless of conventional or high-density measurements. To achieve high-quality recordings, a trade-off between several challenges has to be addressed:
A high dynamic range is needed to measure channels at short and long source-detector distances. Long channels need brighter sources to see good signal, but brighter sources can saturate short channels, reducing signal quality.
With multiple sources closely packed, avoiding crosstalk is a must. Pure time-multiplexing (turning one source on at a time) in a high-density setup reduces the sampling rate.
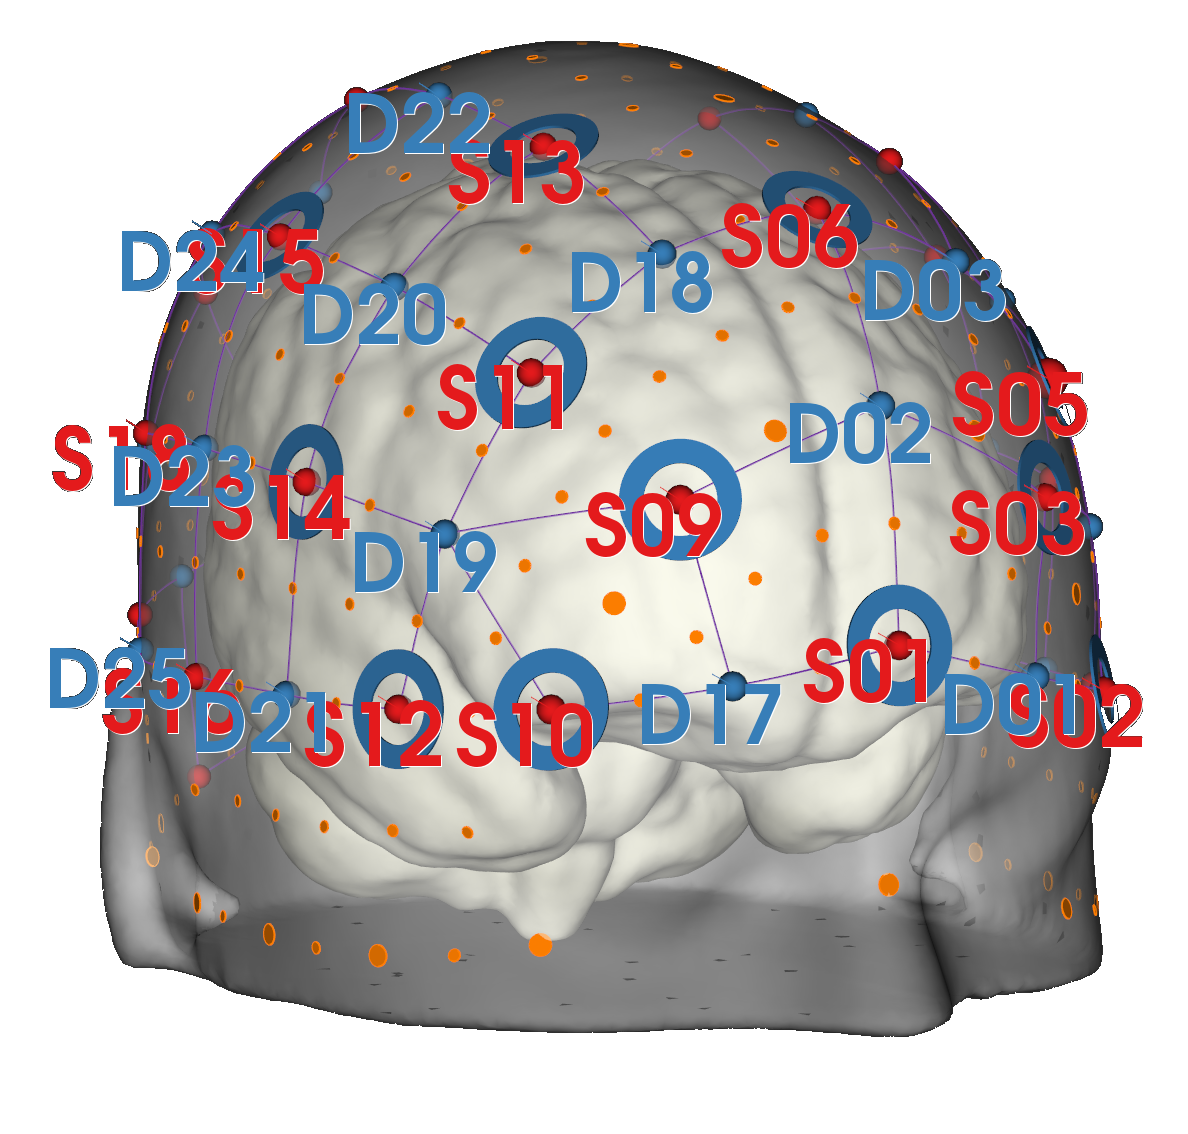
The new Aurora: Multi-Level Illumination and Extended Frequency Encoding
We solved these issues above by unlocking two powerful new features of the NIRSport2 with Aurora: Multi-Level Illumination (MLI) and Extended Frequency Encoding (EFE).
Multi-Level Illumination now enables each source to be used multiple times with different intensities in the same measurement cycle.
This way, optimal signal quality can be achieved despite differences in source-detector distances between channels! The result: optical signal quality at an even higher dynamic range, locally optimized.

Diagram showcasing one use case of the MLI feature. If a source has channels at short distances (e.g. <20 mm short separation channels) and at long distances (e.g. usual >30 mm channels), detectors that are too close to a light source might be “blinded” by the amount of light needed to reach the longer channels. By splitting the source illumination sequence into two parts with different light levels, it is possible to first: (A) use lower-powered light to optimally reach detectors at shorter distances; and then (B) use higher-powered light to optimally reach detectors at longer distances.
Extended Frequency Encoding increases the number of simultaneously used frequencies for signal (de)modulation from two to eight.
What does this mean? More sources close by one another can be turned on at the same time without affecting signal quality by creating crosstalk. This saves precious time switching steps and therefore doubles the available sample rate.
Smart Optimization feature: Both MLI and EFE do not have to be configured by the user.
If enabled, our new Smart Optimization feature automatically figures out the best signal quality and sample rate that can be achieved with your montage.
In summary: Your NIRSport2 gets an upgrade for high-density and higher sample rates, both without making any compromises on the outstanding signal quality that the system is known for. We further empower you to perform DOT fNIRS-based tomographic image reconstruction within our NIRSport2 platform.
Get in touch with us at consulting@nirx.net to find out more
Discover the Power of Satori 2.0: New Features Unveiled!
We are excited to announce the upcoming release of Satori 2.0 in mid-August!
Since the first launch of Satori in 2022, Brain Innovation and NIRx have been collecting feedback from fNIRS scientists about the most important features to include in the next version of the software. With Satori 2.0, we are thrilled to introduce these new and updated features that will enhance your data preprocessing and analysis capabilities. For summaries of the features already available in Satori, check out our tutorial series on YouTube.
In this blog post, we will delve into three key additions:
Python Based Solutions,
The data plotter,
Integrated user guides.
So let's dive in and explore the possibilities of Satori 2.0!
1. Python Integration
One of the most prominent additions are the Python functions executable within the Satori User Interface. Not only can you harness the power of existing Python algorithms and features, but you can also develop and include custom functionalities. This extensibility allows for the rapid expansion of fNIRS algorithms and the incorporation of novel features developed by the scientific community.
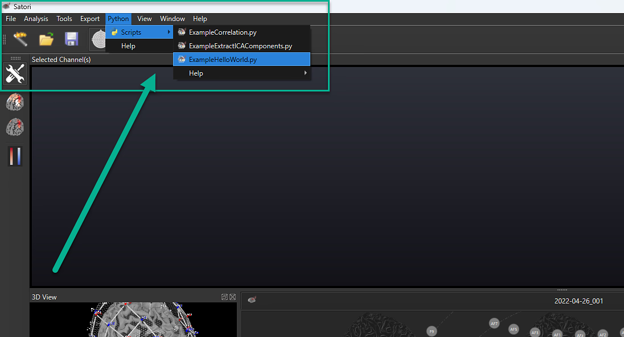
There are two ways Python is integrated into Satori. With the Python Scripts directly executable from the Satori header menu, you can take full control of your data processing pipelines.
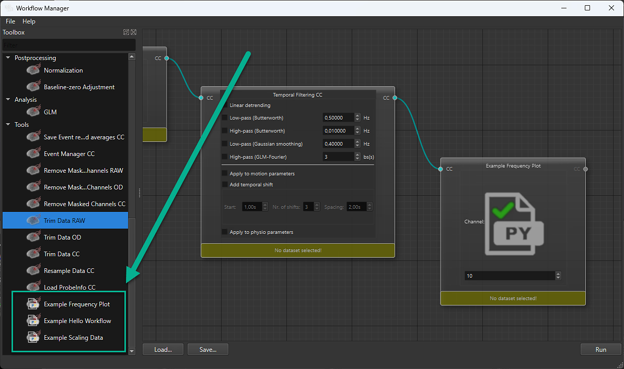
In the Workflow Manager, you can load data and seamlessly incorporate Python Based Workflow Modules which are pre-processing or post-processing the data. We have already included some example scripts which are supported by NIRx and Brain Innovation and documented in the integrated user guide.
2. Data Plotter
Satori 2.0 introduces an exciting new feature, the data plotter. In the data plotter, you can load datasets and view multiple channels simultaneously. While the Selected Channels view allowed for the viewing of multiple channels within a dataset, Satori 2.0 takes it a step further by enabling the visualization of channels from different datasets and the ability to include or exclude specific processing steps. By comparing different pre-processing steps, zooming in on time series data, and toggling the visibility of channels, you gain deeper insights into your data, quickly and easily. The data plotter also allows you to add peripheral physiology, such as data from NIRxWINGS, for a comprehensive analysis.
Of course, Satori 2.0 also brings enhancements to the user interface GUI, making your data analysis experience even more seamless. With improved window scaling, navigating through your data becomes more intuitive and efficient. Beyond the data plotter, additional data and analysis results viewing options are now available.
3. Integrated User Guide
We are excited to announce that improved documentation features accompany each processing step in the modules in the workflow manager and certified Python scripts. This is part of our commitment to equip users with the knowledge, instructions, and resources they need to effectively navigate the software and processing steps. To this end, we also have released a series of training videos available on our YouTube channel. With this comprehensive documentation, we hope users can quickly understand the functionalities of, and concepts behind Satori's data analysis tools.

Conclusion
With the introduction of the data plotter, Python integration, and in-built user guides, Satori 2.0 empowers users to clearly view time series data, customize their workflows, and enjoy an improved user experience. Satori 2.0 will be available in mid-August, contact us at consulting@nirx.net to see how this powerful software could impact your research. Happy data crunching!
Satori 2.0 Introductory Webinar
In August 2023, Dr. Jeremy Burnison from NIRx and Michael Lührs from Brain Innovation gave an overview of Satori and introduced the new Satori features provided with version 2.0.

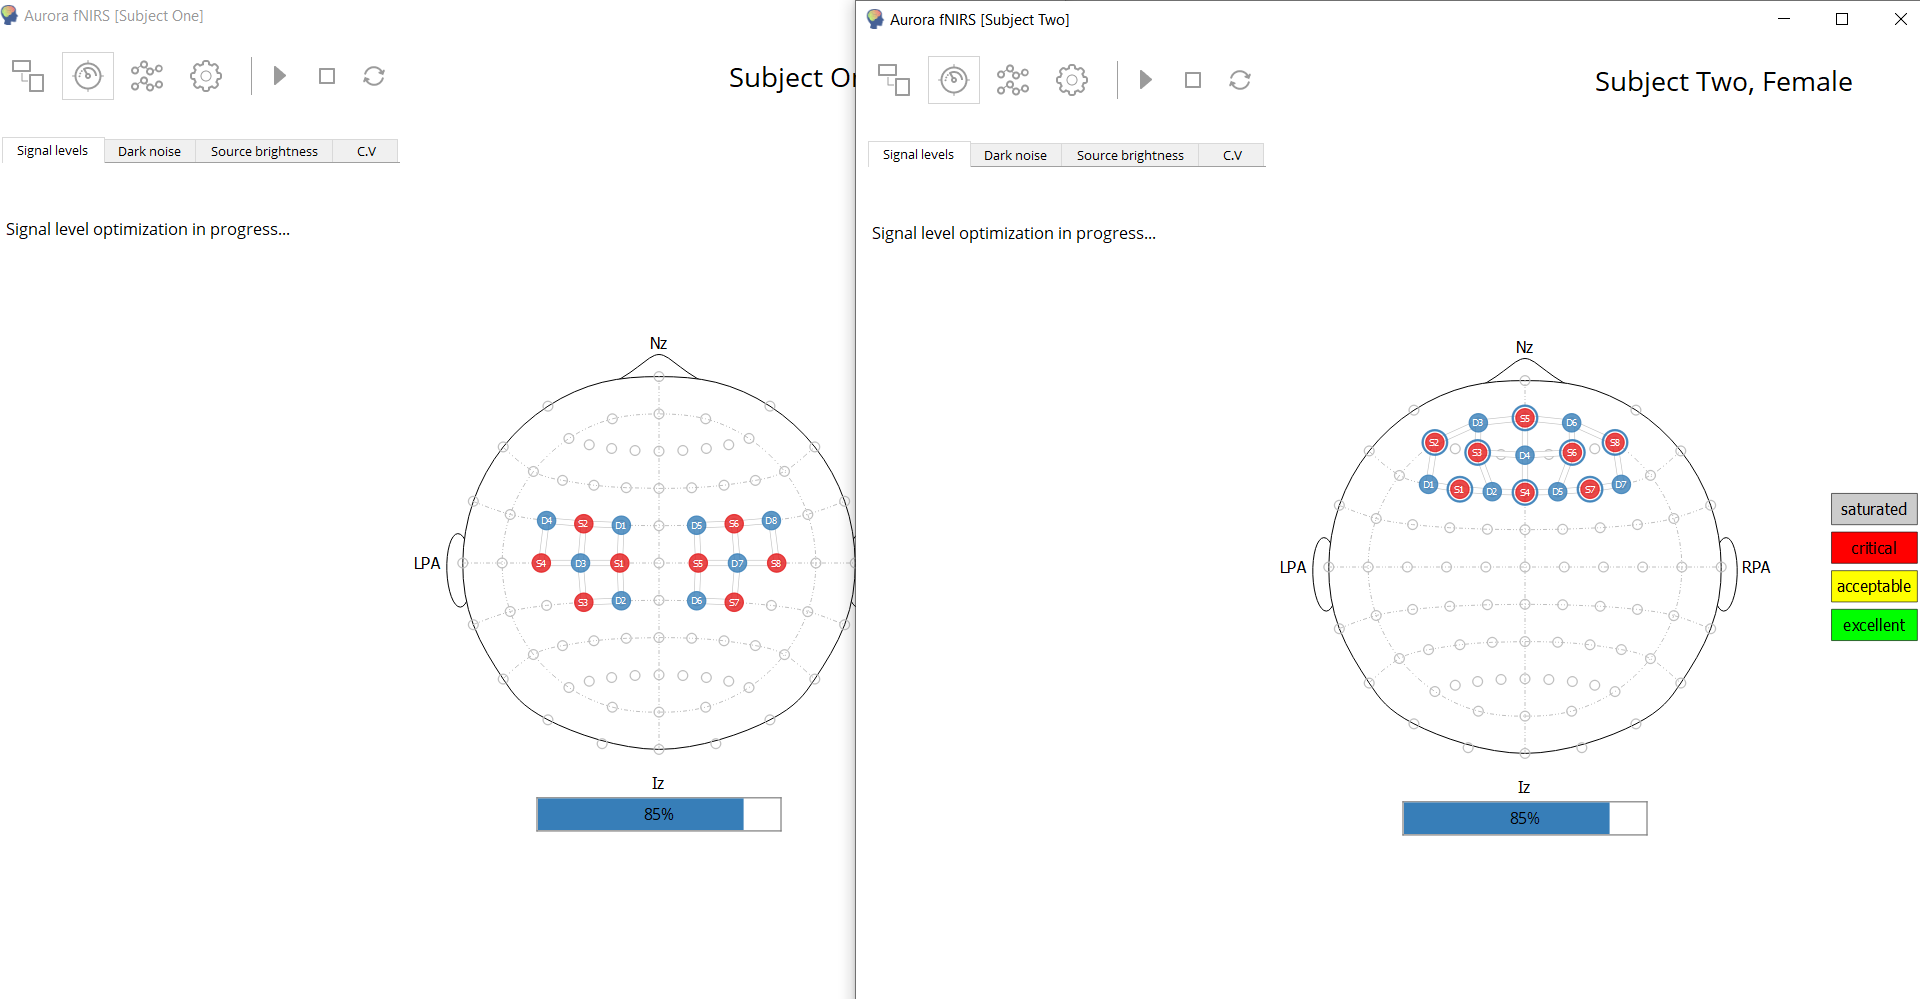
How do I optimize my signal quality?
We are excited to share with you our latest video from our expert colleagues here at NIRx. In this latest release, Demetris take us step by step through the Signal Quality Guide. This guide provides you with the tips and tricks to make sure your signal quality is excellent before beginning your experiment.

This video goes through how to quantitatively and qualitatively assess signal quality.
In Part 1, Demetris takes us through how to assess signal quality. Part 2 shows how to troubleshoot the challenges when things are less than perfect. These two sections follow the Signal Quality Guidelines, available as a PDF on our Support Site. In Part 3, with the help of our colleagues, we show a real-time example of set up, checks, and troubleshooting.
Why Use Physiological Sensors in fNIRS Experiments?
Explaining Variance
In fNIRS recordings, we primarily want to see the signal from the brain. In reality, we also measure non-evoked, systemic activity from the surrounding tissue too (Tachtsidis and Scholkmann, 2016). You can regress out this noise using data from short-channels and physiological sensors. These sensors might include HR, BR, Tonic/Phasic Skin Conductance, Blood Pressure, SpO2 amongst others.
Multi-Modality
Being able to simultaneously measure several global body parameters could enrich your research with more data. It enables you to asses novel mechanisms and concurrent phenomena. A mobile device would allow for naturalistic experiments in complex real-world environments.
Some examples could be: emotional arousal in response to presented stimulus (dos Santos et al 2021), orthostatic hypotension and falls (Mol et al, 2020), cardiac output and respiration (Anh et al, 2016), or concurrent muscle activation (Ortega et al, 2020).
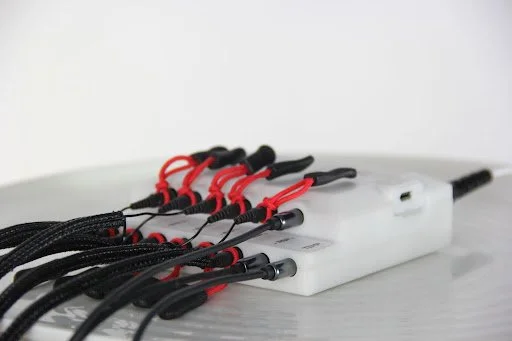
Introducing NIRxWINGS
The NIRxWINGS module for peripheral physiology measurements extends the NIRSport2. Signal processing algorithms can be optimized for artefact rejection (von Lühmann et al, 2019). It enables new experiments and amplifies your datasets with additional biosignal inputs.
Wireless data transfer allows the participant to move freely. Although the device stores data onboard, it also wirelessly streams for real-time display.

Mobililty
With NIRxWINGS, you are able to move outside the lab to conduct systemic physiology augmented fNIRS (SPA-fNIRS). You can access complex, dynamic and multi-sensory real-world environments.

Sensors
Pulse oximetry (PPG)
Heart-rate
Heart-rate variability (HRV),
Oxygen saturation (SpO2),
Respiration,
Temperature,
Galvanic skin response (GSR),
Bipolar signals such as EMG and ECG.
The physiology data from NIRxWINGS coupled with short-channels and motion sensors are highly effective in explaining the error variance in your fNIRS signal.
Check out this page to find more NIRxWINGS features.
Want to know more about this product? Send us an e-mail at support@nirx.net
References:
Tachtsidis, I., & Scholkmann, F. (2016). False positives and false negatives in functional near-infrared spectroscopy: issues, challenges, and the way forward. Neurophotonics, 3(3), 031405. https://doi.org/10.1117/1.NPh.3.3.031405
**Technical References:**
von Lühmann, A., Boukouvalas, Z., Müller, K. R., & Adalı, T. (2019). A new blind source separation framework for signal analysis and artifact rejection in functional near-infrared spectroscopy. NeuroImage, 200, 72-88. https://doi.org/10.1016/j.neuroimage.2019.06.021
von Lühmann, A., Li, X., Gilmore, N., Boas, D. A., & Yücel, M. A. (2020). Open Access Multimodal fNIRS Resting State Dataset With and Without Synthetic Hemodynamic Responses. Frontiers in Neuroscience, 14. https://doi.org/10.3389/fnins.2020.579353
**Use Cases**
Useful to identify user attention, stress, and vigilance, to detect and differentiate evoked systemic physiology in fNIRs.
Ahn, S., Nguyen, T., Jang, H., Kim, J. G., & Jun, S. C. (2016). Exploring neuro-physiological correlates of drivers' mental fatigue caused by sleep deprivation using simultaneous EEG, ECG, and fNIRS data. Frontiers in human neuroscience, 10, 219. https://doi.org/10.3389/fnhum.2016.00219
Ortega, P., Zhao, T., & Faisal, A. A. (2020). HYGRIP: Full-Stack Characterization of Neurobehavioral Signals (fNIRS, EEG, EMG, Force, and Breathing) During a Bimanual Grip Force Control Task. Frontiers in Neuroscience, 14. https://doi.org/10.3389/fnins.2020.00919
Mol, A., Maier, A. B., van Wezel, R. J., & Meskers, C. G. (2020). Multimodal monitoring of cardiovascular responses to postural changes. Frontiers in physiology, 11, 168. https://doi.org/10.3389/fphys.2020.00168
dos Santos, F. R., Bazán, P. R., Balardin, J. B., de Aratanha, M. A., Rodrigues, M., Lacerda, S., ... & Kozasa, E. H. (2021). Changes in Prefrontal fNIRS Activation and Heart Rate Variability During Self-Compassionate Thinking Related to Stressful Memories. Mindfulness, 1-13. https://doi.org/10.1007/s12671-021-01789-0

Welcome Satori - the new fNIRS analysis software from Brain Innovation

Written by Dr. Michael Lührs of Brain Innovation B.V.
We are very happy to present to you the first version of Satori, an analysis software for functional near-infrared spectroscopy (fNIRS) data. Whereas Turbo-Satori, the previous release from Brain Innovation, is designed and optimized for real-time applications such as neurofeedback and brain-computer interface (BCI), Satori aims directly at offline analysis.
It is specifically designed to integrate easily with your research while providing state of the art processing and analysis pipelines.
Satori was first developed as an in-house project to easily preprocess and analyze our own fNIRS data. We quickly realized its potential and are now very happy to be able to make it available for everyone.The usability of the software is thereby one of Satori’s highlights. The fNIRS data can be inspected at any time and visualized in different forms and layouts. Please take a look at the shot below for a first glimpse of Satori.
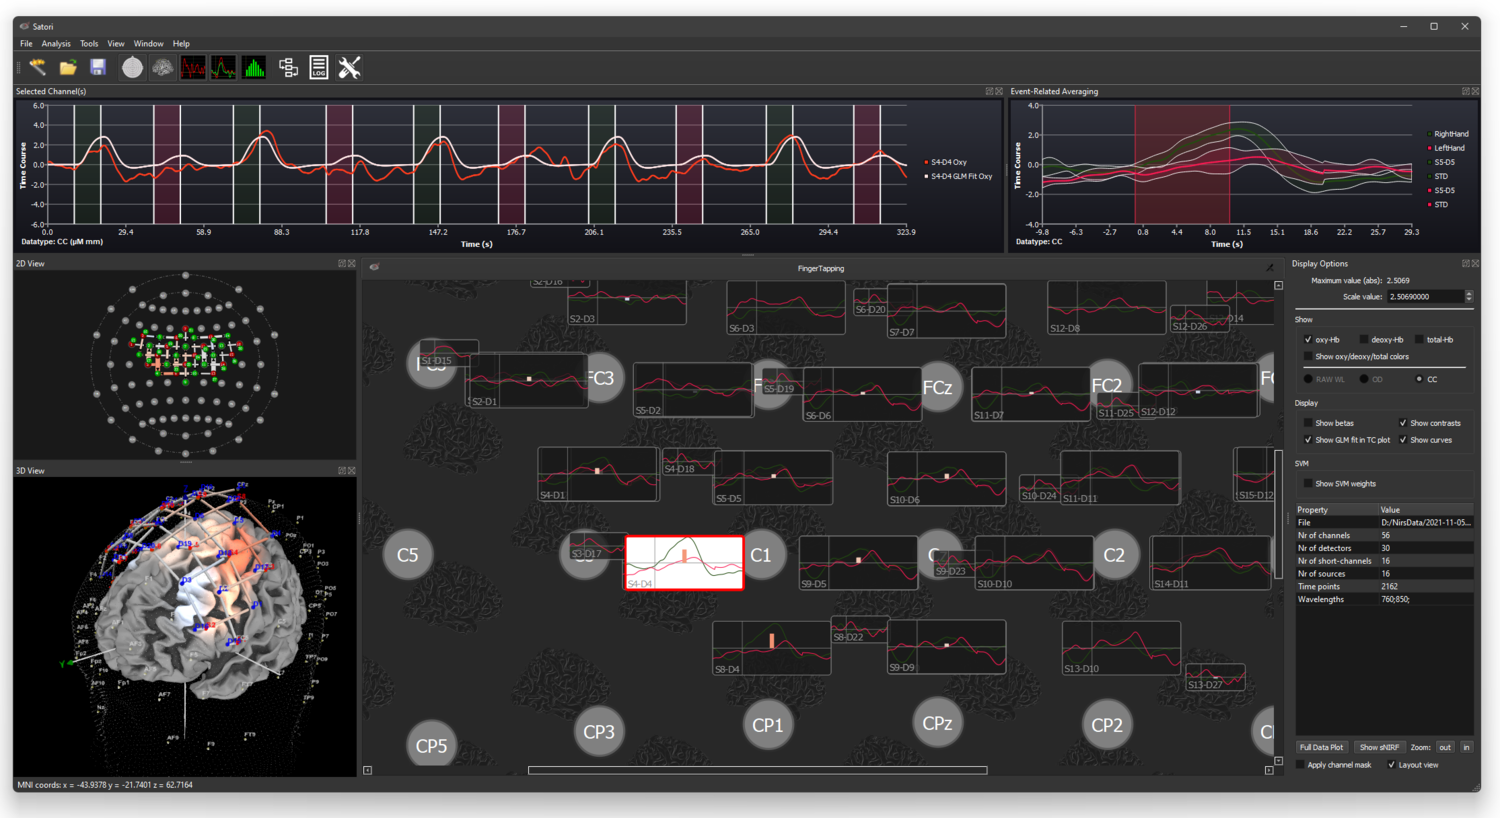
Having the possibility to inspect multiple views of the data at the same time allows for a much better orientation of the location of specific brain activity. In the example above, you can clearly see more activity on the left hemisphere induced by right-hand finger tapping.
Of course, the windows to inspect the data can be freely arranged and detached from the main window. This allows for a more detailed view as you can see below.

The time course of individual channels can be inspected for the different chromophores (Oxy, DeOxy and Total Hemoglobin). This includes the simultaneous view of event related averages and the whole channel time course. The versatility of Satori allows you to quickly review and understand the fNIRS data before deciding on the most suitable preprocessing and analysis method.
The launch of this first version promises continuous developments, support, and education to make fNIRS more accessible to researchers in the years to come. Stay tuned for future updates of Satori which will include direct access to Python, further developments for the Flow manager (a tool to organize and streamline your preprocessing and analysis).
We are looking forward to an exciting journey together with you!
New Software Updates Aurora + NIRSite
We are delighted to announce new software versions for Aurora and NIRSite by NIRx. They may already be downloaded from our Help Center!
We are delighted to announce new software versions for Aurora and NIRSite by NIRx. They may already be downloaded from our Help Center! These updates include compatibility for MacOS and the Hyperscan application. Thank you to our team in Berlin for making this happen.

Aurora 2021.4: Data acquisition with NIRSport2
New features and improvements
Support of single device split Hyperscanning in Hyperscan application. Ability to choose two different (max. 8x8) configurations to run from one NSP2 device, support for short channels and accelerometer. Independent visualization of data, separate storage of data.
LSL stream update: Inclusion of subject information (name, age, etc.) in LSL stream metadata.
Full accelerometer data in LSL stream.
Full accelerometer data (100 Hz) in SNIRF file.
Accelerometer samples (in LSL stream, *.acc, and SNIRF file) are corrected for drift of clock between NSP2 and accelerometer.
More default montages & configurations included when Aurora is initially installed.
Bug fixes and changes
Better error messages/handling when writing access to Documents folder is denied by Windows
Validation of "Data root directory" and "Configuration directory" on the settings page (i.e. errors when the directory does not exist or Aurora can't write to it)
Hyperscan data now saved in the Hyperscan folder instead of the Data folder.
Better validation of custom channel names/labels

NIRSite 2021.4: Montage Creation
Bug fixes and changes
Compatibility now spans from macOS Mojave to Big Sur.
Optode positions created in the fNIRS Optodes’ Location Decider (fOLD) can be loaded directly into NIRSite (if saved in ASCII format).
Digpts.txt file is automatically generated in the montage folder.

Additionally, we will be hosting an open webinar 11th May, 10 am EST/ 4 pm CET on Hyperscan: The hyperscanning feature for NIRSport2 + Aurora that will go over many of these features - see you there!
Would you like to learn more? Feel free to reach out to our support team. We’d be happy to hear from you.
Turbo-Satori Webinar
Register now for the webinar
Neurofeedback, real-time data analysis and Brain Computer Interface (BCI) paradigms are becoming increasingly popular in fNIRS research. To facilitate the requests of many researchers, NIRx has partnered with Brain Innovation, whom have developed an advanced, real-time analysis software that allows for fast, result-driven high-quality fNIRS research: Turbo-Satori.

We would like to invite you to a Introduction to Turbo-Satori webinar, on February 28. During this webinar, Mr. Michael Lührs - head developer of Turbo-Satori, will give a walk-through of the software and discuss its advantages and possible applications.
Reserve your spot for the Webinar now, and sign-up below!
Introduction to Turbo-Satori, a real-time Analysis Program for fNIRS data
Date: 28.2.2019
Time: 4 pm CET, 10 am EDT
Interested to learn more about Turbo-Satori in advance? Have a look at its publication in Neurophotonics, or contact NIRx to discuss integrating Turbo-Satori with your current or desired fNIRS set-up!
NIRSite 2.0
We are excited to announce NIRSite 2.0!
The second installment of NIRSite has arrived! Read about the new features here, such as easy addition of short-distance channels, automatic export of montages, renaming source and detector labels, and much more!

Following the success of the first release of NIRSite, we are excited to share with you the updated and much improved NIRSite 2.0. Packed with new features and important bug fixes, NIRSite 2.0 makes creation of montages / optode-arrangements easier than ever!

What’s new in NIRSite 2.0?
Effortless addition of short-distance channels
Manual manipulation of measurement channels
Renaming source and detector labels
Creation of montages in the two-dimensional view
Automatic export to NIRStar and Aurora montage folders
Visit the NIRx Help Center to learn more about NIRSite 2.0, and download your own copy free of charge.
In addition, we warmly invite you to attend the upcoming NIRSite 2.0 Webinar, scheduled for March 7 2019. Visit our Webinar page for more details!