As an fNIRS researcher, you understand the importance of staying at the forefront of knowledge and technology. To this end, NIRx Medical Technologies and Brain Innovation launched in 2022 an innovative software product called Satori. Satori is an easy-to-use and powerful fNIRS analysis software. It includes the current standard fNIRS processing methods and statistical tools. Check out a recent overview video here.
As part of a commitment to support our customers, we have created a comprehensive playlist of training videos for researchers starting out with this state-of-the-art software. From setting up preprocessing pipelines to accessing data analysis tools, this Tutorial Series provides a clear overview of the Satori interface, enabling researchers to maximize their efficiency. In this blog post, we will take a look at what you can expect from these videos. We hope they can help you get started with Satori and bring you closer to your next publication.
Mastering the Satori Interface
The Satori software tutorial series begins with an introduction to the user interface, ensuring that researchers become familiar with its features and functionalities. This helps users navigate through the software with ease, saving valuable time and streamlining their workflow. There is a clip describing the event manager where users can easily edit their experimental paradigm ready for preprocessing and analysis.
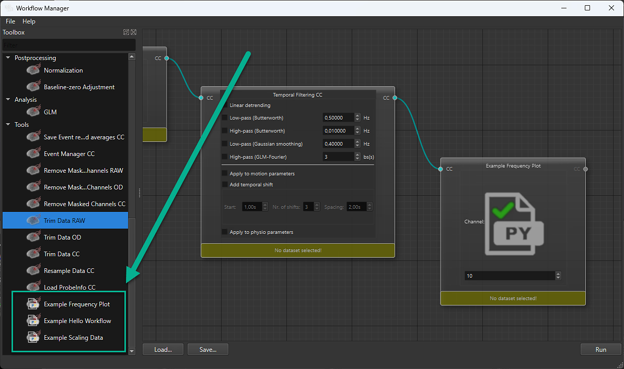
The videos also guide users through the workflow manager in which all Satori’s features such as transformations, preprocessing, post-processing, and analysis steps, can be dragged into a clear visualisation tool. This can be easily shared with your collaborators.

Data preprocessing and analysis
One of the most valuable aspects of Satori's software tutorial series is the focus on data preprocessing and analysis methods readily available within the software. These techniques are based on the most common and robust methods in the literature. The videos offer guidance on preprocessing options specific to your data. Researchers are shown the built-in methods like temporal filtering, short channel regression (in both preprocessing and analysis), normalization, channel rejection, and motion correction parameters such as TDDR (temporal derivative distribution repair), CBSI (correlation-based signal improvement), and spike correction. You can also learn how to configure each option in advanced settings.

These videos also provide information on how to analyse experiments within Satori. With the tutorial on running a single study GLM, users are shown how to set up the analysis, manage statistical parameters and thresholds, setting contrasts and including confound regressors. Satori is also able to run multi-study GLM analysis, SVM training, cross- and anti- correlation.
Advanced Data Visualization and Interpretation
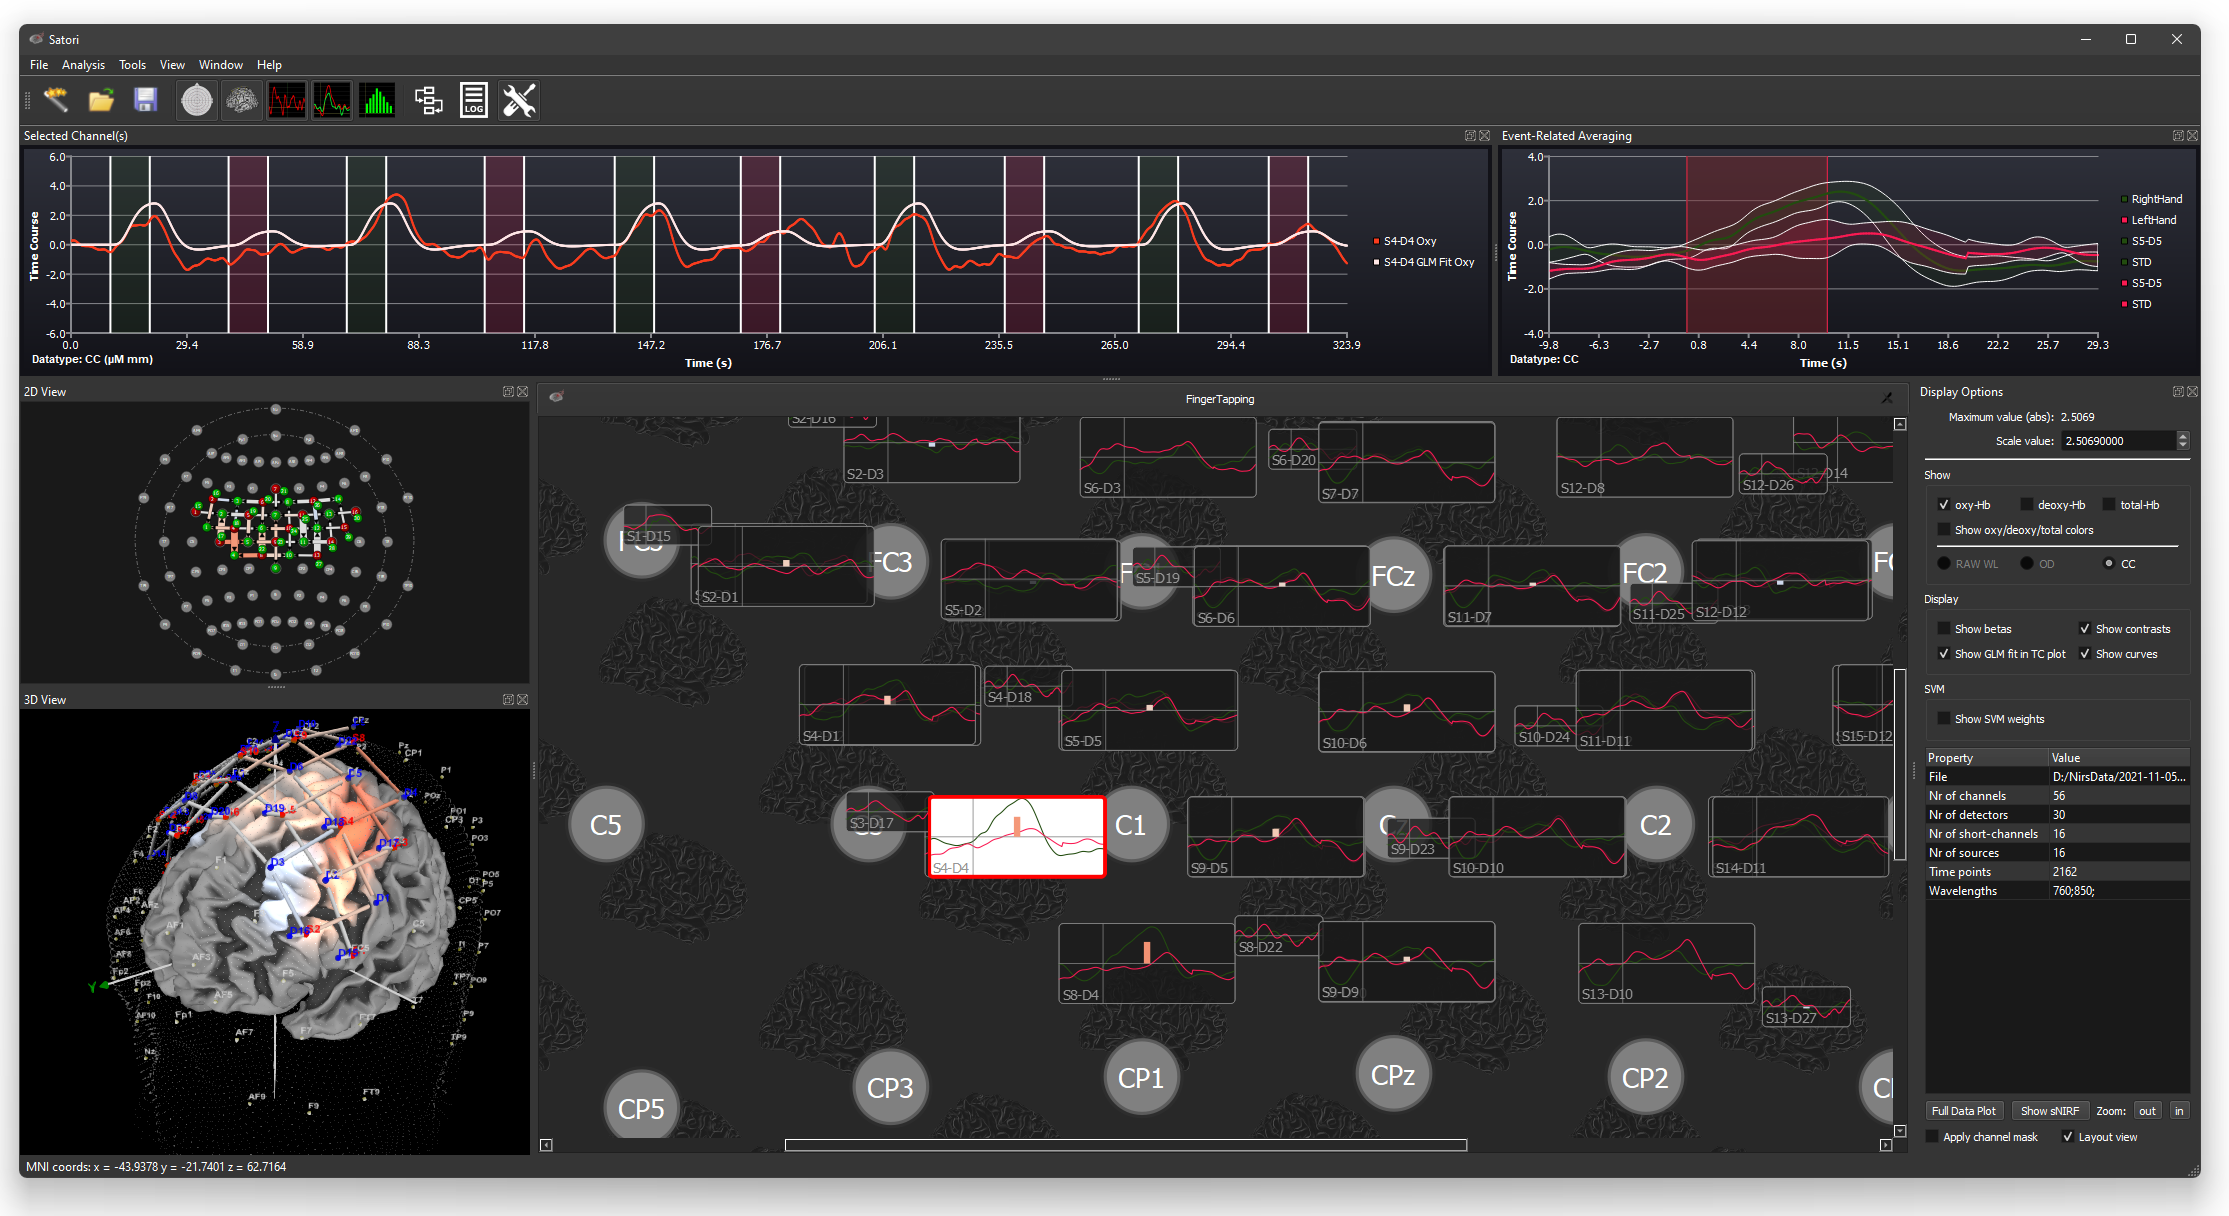
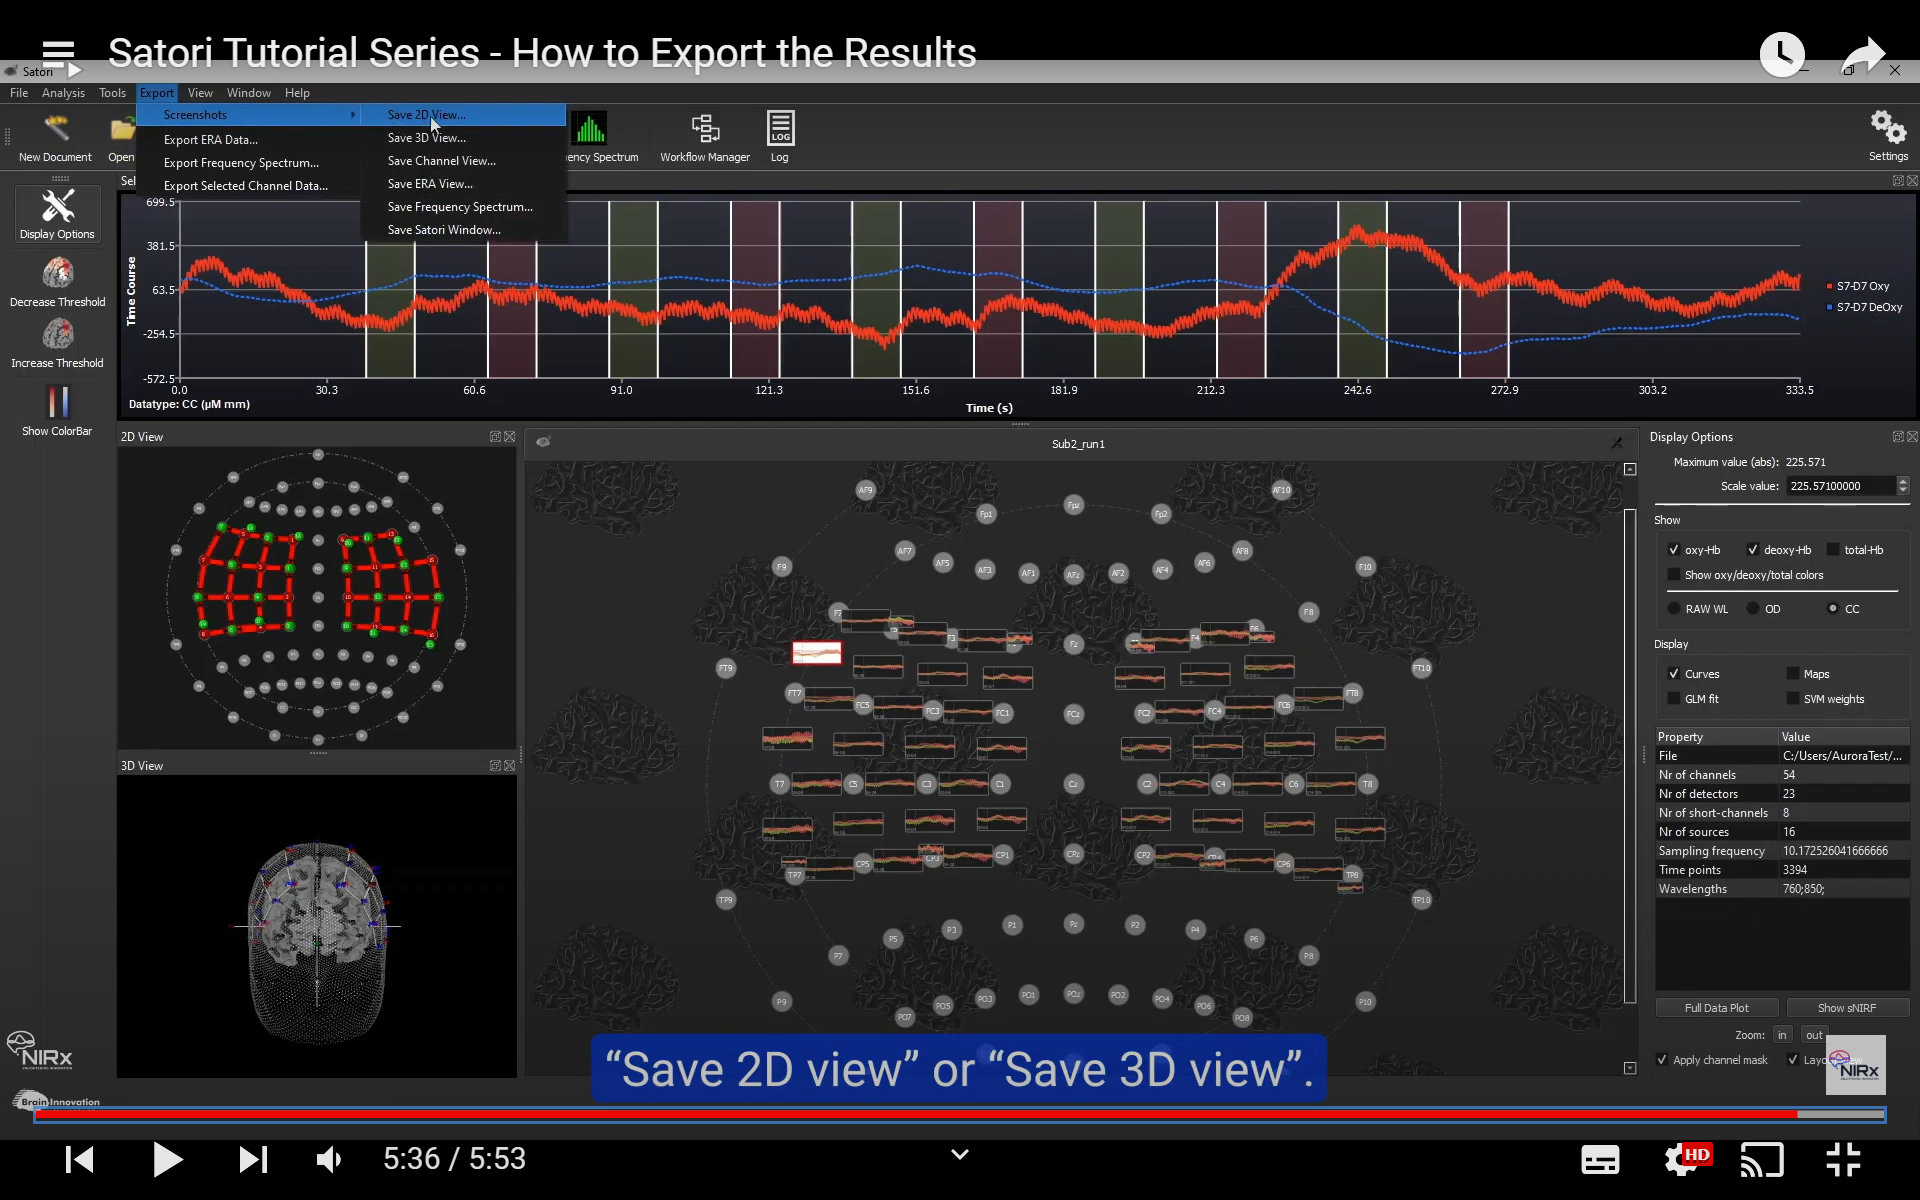
Data visualization is key to effectively communicating research findings. With Satori, this is accessible in just a few clicks. Satori's software training videos provide researchers with a quick overview of the data visualization techniques included. Part 2 of the single study GLM tutorial gives an example of how these visualization tools can be leveraged to transform complex data sets into clear, insightful visual representations with simple customization options for thresholds. These channel maps, graphs, and images can then be easily exported. These videos teach scientists how to display their data in a visually appealing manner within Satori, enhancing the dissemination and understanding of their research.
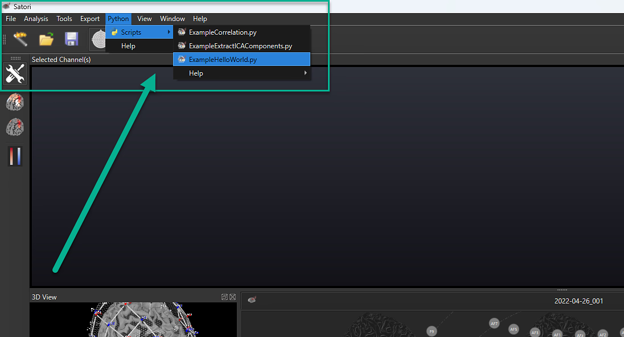
Extend Satori 2.0 with Python
We are excited to announce that the latest release, Satori 2.0 has inbuilt integration with Python. You can expand the capabilities of the software with your own scripts! We hope this interoperability empowers researchers to combine the strengths of Satori with other tools you may already be using, fostering a flexible and tailored approach to your research projects. Check out our recent webinar on these new features of Satori.
Conclusion
Scientific research is a dynamic and ever-evolving field, and staying ahead requires continuous learning and the adoption of cutting-edge technologies. Satori empowers researchers to get to the heart of their data with ease, without having to code a single line.
From mastering the software interface to preprocessing, analysis, advanced visualization, and integration with third-party tools, Satori's tutorial videos offer a helpful resource for researchers, equipping them with the skills and knowledge necessary to unlock their full potential with this fNIRS software.
Take your research to the next level with Satori! Subscribe to our Youtube Channel for more videos to come as features are added to Satori or contact us at consulting@nirx.net to find out more.